
The 7 best surveys for tracking deforestation from above include LiDAR-based canopy density analysis, multispectral imaging for vegetation health, and thermal sensing of forest cover. Time-lapse aerial photography comparison offers historical insights, while GPS-enabled tree counting surveys provide ground-truth data. AI-powered change detection mapping rapidly analyzes vast datasets, and hyperspectral forest species identification helps monitor biodiversity. These methods use advanced technologies to detect subtle changes, map large areas, and provide real-time insights into forest health. Each technique offers unique advantages, from penetrating cloud cover to identifying specific tree species. Exploring these survey methods will equip you with powerful tools to combat deforestation effectively.
LiDAR-Based Canopy Density Analysis
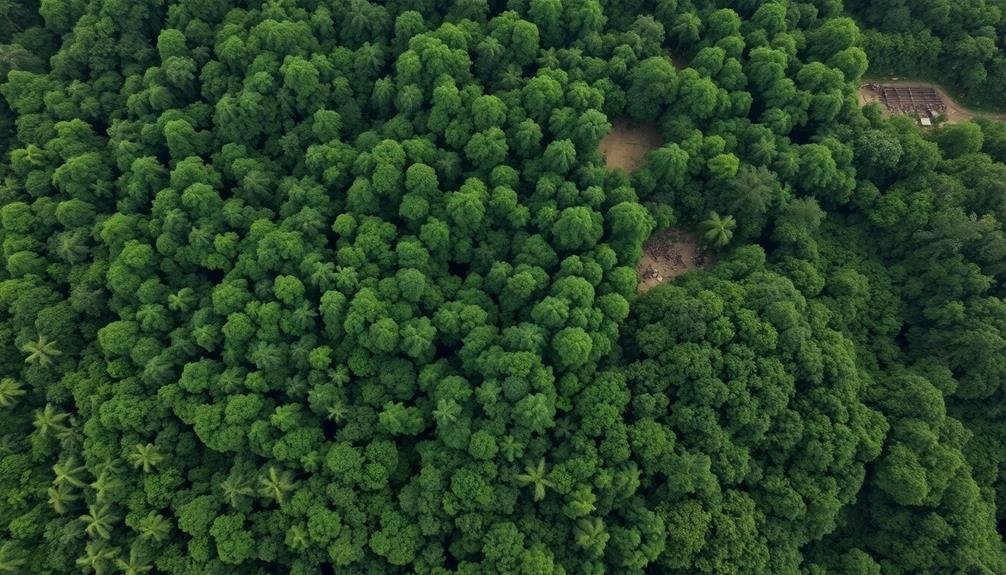
Countless forest researchers rely on LiDAR technology to assess canopy density accurately. LiDAR, which stands for Light Detection and Ranging, uses laser pulses to create detailed 3D maps of forest structures. You'll find that this method provides high-resolution data on tree height, canopy cover, and understory vegetation.
To conduct a LiDAR-based canopy density analysis, you'll need to mount the LiDAR sensor on an aircraft or drone. As you fly over the forest, the sensor emits rapid laser pulses that bounce off vegetation and return to the device. The time it takes for each pulse to return helps calculate the distance to various forest elements.
You'll process this data to create a point cloud, which represents the forest's vertical structure. From this, you can derive canopy density metrics, such as Leaf Area Index (LAI) and gap fraction. These measurements allow you to quantify changes in forest cover over time, making it easier to detect and monitor deforestation.
LiDAR's ability to penetrate the canopy gives you a thorough view of forest structure, making it an invaluable tool for tracking deforestation and forest degradation.
Multispectral Imaging for Vegetation Health

Moving beyond LiDAR, multispectral imaging offers a powerful tool for evaluating vegetation health and detecting early signs of deforestation. This technology captures data across multiple wavelengths of light, including those invisible to the human eye.
You'll find that multispectral sensors can detect subtle changes in plant physiology, revealing stress or damage before it's visible on the ground.
When you're tracking deforestation, multispectral imaging helps you identify areas of concern quickly. It can distinguish between healthy and unhealthy vegetation, pinpointing regions where trees are struggling or have been removed.
You'll be able to detect changes in chlorophyll content, leaf water content, and overall plant vigor.
Thermal Sensing of Forest Cover
You'll find thermal sensing to be a powerful tool for tracking deforestation.
Heat signatures can reveal changes in forest cover that aren't visible to the naked eye or traditional imaging methods.
Heat Signatures Reveal Changes
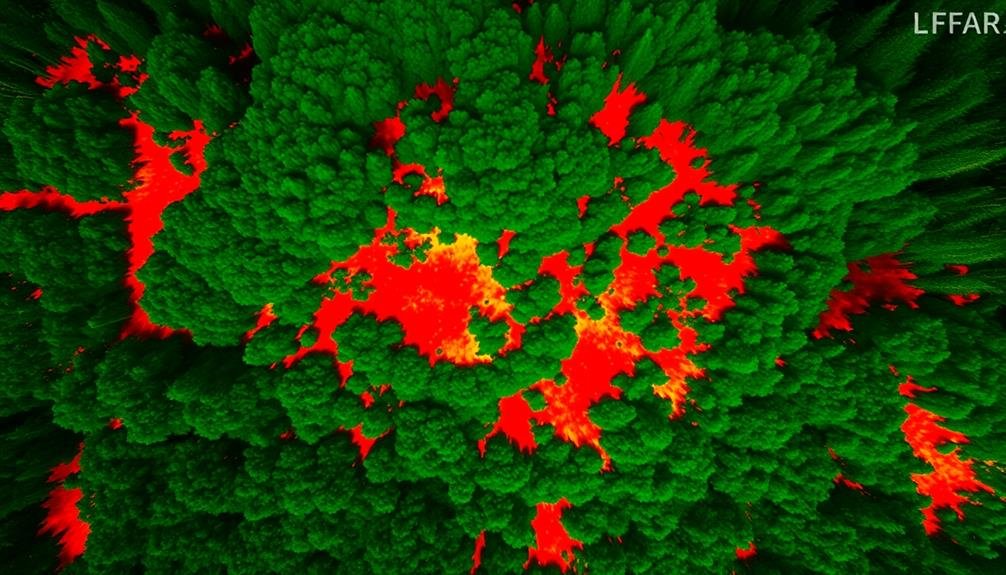
Thermal imaging has revolutionized the way we track deforestation. By detecting heat signatures, you can identify changes in forest cover that might be invisible to the naked eye or traditional satellite imagery. As trees are cleared, the exposed soil and new vegetation have different thermal properties, creating distinct heat patterns.
You'll find that thermal sensors can detect these changes even when cloud cover obstructs visual observations. This makes them particularly useful in tropical regions where cloud cover is common. The data you gather can reveal not only large-scale deforestation but also subtle changes like selective logging or forest degradation.
To interpret thermal imagery effectively, you'll need to account for factors like time of day, season, and local climate conditions. Advanced algorithms can help you analyze these heat signatures over time, allowing you to track trends and identify areas at risk of future deforestation.
Nighttime Canopy Monitoring
At night, forest canopy monitoring takes on a new dimension with thermal sensing technology. You'll find that thermal cameras can detect subtle temperature differences between healthy vegetation and areas affected by deforestation or degradation. This method allows you to track changes in forest cover even when visible light isn't available.
Thermal imaging works by capturing the heat signatures emitted by different surfaces. Healthy forests tend to have cooler temperatures due to evapotranspiration, while cleared or degraded areas appear warmer. You can use this contrast to identify areas of concern and track changes over time.
One advantage of nighttime thermal sensing is that it's less affected by cloud cover than daytime optical imagery. You'll also avoid issues with shadows that can complicate daytime observations. However, you'll need to account for seasonal variations in temperature and moisture levels when interpreting the data.
To get the most out of nighttime canopy monitoring, you should combine it with other survey methods. By integrating thermal data with LiDAR, multispectral imaging, and ground-based observations, you'll build a more thorough picture of forest health and deforestation trends.
Time-Lapse Aerial Photography Comparison

You'll find that time-lapse aerial photography comparison is a powerful tool for tracking deforestation over extended periods.
To analyze historical images effectively, you'll need specialized software capable of detecting changes in vegetation cover between different time points.
As you interpret these shifts in forest cover, you'll gain valuable insights into deforestation patterns and rates, allowing for more informed conservation strategies.
Historical Image Analysis Techniques
Historical image analysis techniques, particularly time-lapse aerial photography comparison, have revolutionized our ability to track deforestation over extended periods. You'll find these methods incredibly useful for identifying long-term trends and patterns in forest cover change. By comparing aerial photographs taken at different times, you can visualize and quantify the extent of deforestation over decades.
To effectively use historical image analysis, you'll need to:
- Acquire high-quality aerial photographs from different time periods
- Georeference and align images for accurate comparison
- Develop a classification system for land cover types
- Use image processing software to detect and measure changes
- Validate results with ground-truthing or other data sources
When you're analyzing these images, you'll notice changes in forest boundaries, fragmentation patterns, and the emergence of new land uses. You can also identify reforestation efforts and natural regrowth.
Software for Change Detection
When it comes to analyzing time-lapse aerial photography for deforestation tracking, specialized software plays a significant role. You'll find several powerful tools designed specifically for change detection in satellite and aerial imagery. These programs use advanced algorithms to compare images from different time periods, highlighting areas where forest cover has diminished.
One popular option is ENVI, which offers robust change detection capabilities. It allows you to process large datasets and apply various analysis techniques to identify deforested areas.
Another widely used software is eCognition, which excels in object-based image analysis and can detect subtle changes in forest structure over time.
For open-source alternatives, you might consider QGIS with its change detection plugins. These tools enable you to perform multi-temporal analysis and create detailed maps of forest loss.
Additionally, Google Earth Engine provides a cloud-based platform for analyzing satellite imagery at scale, offering pre-built functions for deforestation monitoring.
When selecting software, consider factors like ease of use, compatibility with your data formats, and the specific change detection algorithms offered.
It's also essential to guarantee the software can handle the resolution and volume of your aerial photography datasets efficiently.
Interpreting Vegetation Cover Shifts
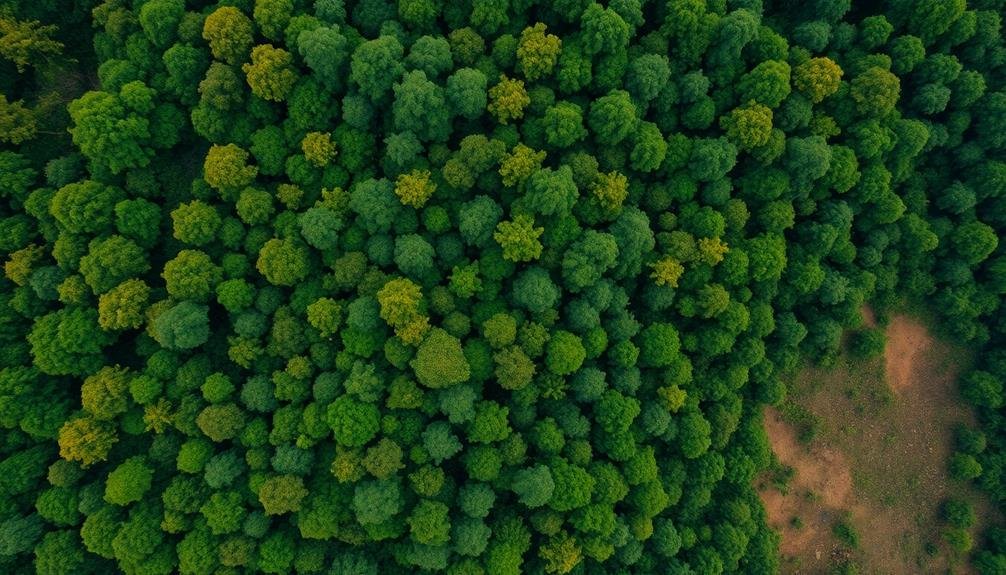
Frequently, interpreting vegetation cover shifts through time-lapse aerial photography comparison requires a keen eye and systematic approach. You'll need to analyze multiple images taken over time to detect changes in forest cover. Look for patterns in color, texture, and density to identify areas of deforestation or regrowth.
To effectively interpret vegetation cover shifts, consider these key points:
- Compare images from the same season to avoid confusion due to natural seasonal changes
- Use high-resolution images for more accurate analysis
- Establish a consistent classification system for different types of vegetation
- Pay attention to the edges of forested areas, where deforestation often begins
- Look for signs of human activity, such as new roads or agricultural expansion
As you examine the images, you'll want to quantify the changes you observe. Measure the area of deforested land and calculate the rate of change over time.
It's essential to distinguish between natural disturbances, like wildfires, and human-induced deforestation. By carefully interpreting these aerial photographs, you'll gain valuable insights into the dynamics of forest cover change in your study area.
GPS-Enabled Tree Counting Surveys
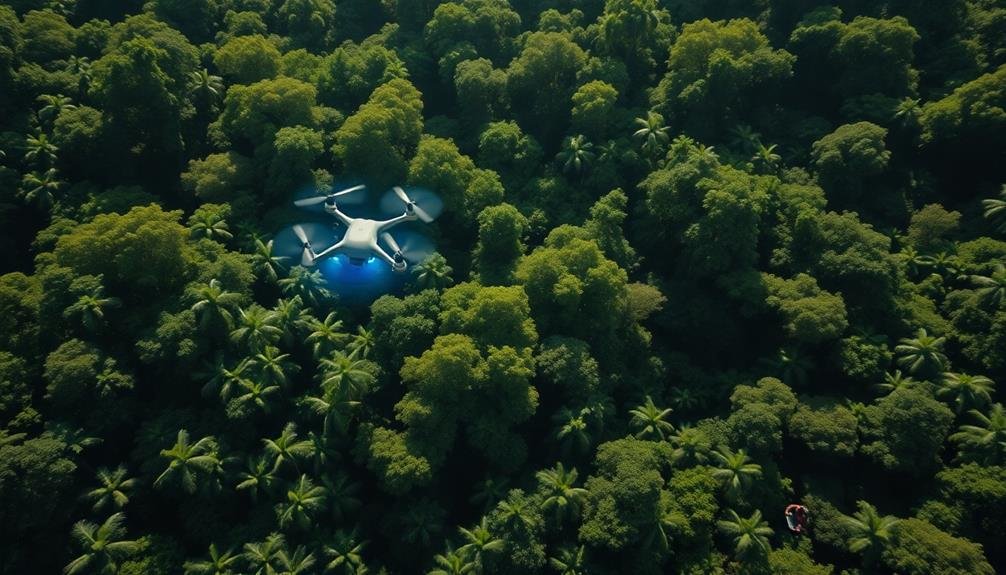
GPS-enabled tree counting surveys revolutionize deforestation tracking by combining cutting-edge technology with traditional field methods. You'll find these surveys particularly useful for obtaining accurate, real-time data on forest cover changes. By equipping field workers with GPS-enabled devices, you can precisely map and count individual trees within defined areas.
These surveys allow you to create detailed inventories of tree species, sizes, and health conditions. You'll be able to track changes over time by repeating surveys in the same locations. The GPS functionality guarantees that you can return to exact spots for consistent monitoring. You'll also benefit from the ability to integrate this data with satellite imagery for extensive analysis.
When conducting GPS-enabled tree counting surveys, you'll need to train your team on proper use of the devices and data collection protocols. It's vital to establish a systematic sampling method to cover representative areas of the forest.
You'll want to take into account factors like terrain, accessibility, and forest density when planning your survey routes. By combining this ground-level data with aerial imagery, you'll gain a more complete picture of deforestation trends and patterns.
AI-Powered Change Detection Mapping

With the advent of artificial intelligence, change detection mapping has taken a giant leap forward in tracking deforestation. You'll find that AI-powered algorithms can now analyze satellite imagery with unprecedented speed and accuracy, spotting even subtle changes in forest cover over time.
These cutting-edge systems use machine learning to identify patterns and anomalies in vast datasets, allowing you to detect:
- Illegal logging activities
- Forest fires and their aftermath
- Agricultural encroachment
- Urban expansion into forested areas
- Natural disasters affecting tree cover
You'll appreciate how AI-powered change detection mapping provides near real-time insights, enabling rapid response to emerging threats.
It's not just about identifying where deforestation has occurred; these tools can also predict future risk areas based on historical patterns and environmental factors.
Hyperspectral Forest Species Identification
Hyperspectral forest species identification's power lies in its ability to distinguish individual tree species with remarkable accuracy. This technology captures light across hundreds of narrow spectral bands, revealing unique spectral signatures for different plant species. You'll find that hyperspectral sensors can detect subtle variations in leaf chemistry, canopy structure, and moisture content, allowing for precise tree identification.
When you're tracking deforestation, this method offers significant advantages. You can map biodiversity hotspots, monitor invasive species, and identify vulnerable or endangered tree populations. It's particularly useful in tropical regions where forest composition is complex and diverse.
To use hyperspectral imaging effectively, you'll need specialized sensors mounted on satellites or aircraft. The data collected requires sophisticated processing algorithms to interpret the spectral information. You'll also need to build an extensive spectral library of known tree species for accurate identification.
While hyperspectral imaging is powerful, it's often more expensive and data-intensive than other remote sensing methods. However, its unparalleled ability to discern individual species makes it an invaluable tool for detailed forest composition analysis and targeted conservation efforts.
Frequently Asked Questions
How Do Weather Conditions Affect the Accuracy of Aerial Deforestation Surveys?
You'll find that cloud cover, rain, and fog can greatly reduce visibility and image quality in aerial surveys. They'll obscure the forest canopy, making it harder to accurately assess deforestation. Clear, dry conditions are ideal for best results.
What Is the Cost Difference Between Satellite and Drone-Based Forest Monitoring?
You'll find satellite monitoring is generally more expensive for large areas, while drones are cost-effective for smaller regions. However, satellite costs are decreasing. Consider your specific needs and budget when choosing between these options.
How Often Should Aerial Surveys Be Conducted for Effective Deforestation Tracking?
You'll want to conduct aerial surveys at least annually for effective deforestation tracking. However, if you're monitoring high-risk areas or rapid changes, you should consider more frequent surveys, possibly quarterly or even monthly, to capture ongoing developments.
Can These Survey Methods Detect Illegal Logging Activities in Real-Time?
You'll find that real-time detection of illegal logging is challenging. While some survey methods can spot recent changes, they're not instantaneous. You'd need frequent monitoring and rapid data processing to approach real-time tracking of illegal activities.
What Are the Limitations of Using AI in Deforestation Detection?
You'll find AI in deforestation detection has limitations. It can't always distinguish natural changes from human-caused ones, may struggle with cloud cover, and requires high-quality data. It's also dependent on consistent satellite imagery availability.
In Summary
You've now explored seven powerful aerial survey techniques to monitor deforestation. From LiDAR and multispectral imaging to AI-powered mapping, these methods offer unparalleled insights into forest health and change. By combining these tools, you'll gain a thorough view of deforestation trends. Remember, the key is to use multiple approaches for the most accurate picture. Keep innovating and adapting these technologies to stay ahead in the fight against forest loss.
As educators and advocates for responsible drone use, we’re committed to sharing our knowledge and expertise with aspiring aerial photographers.

Leave a Reply