To decode aerial photography histograms, start by understanding that they represent your image's tonal range. Look for a balanced distribution, with peaks in the middle indicating well-exposed midtones. Watch for clipping at the edges, which signals loss of detail in shadows or highlights. Adjust your exposure based on where peaks concentrate—left for darker, right for brighter. Consider sky conditions and atmospheric haze, using filters or post-processing to compensate. Monitor your histogram in real-time through live view, and shoot in RAW for maximum data retention. By mastering these key tips, you'll reveal the full potential of your aerial shots.
Key Takeaways
- Understand histogram basics: left represents shadows, middle shows midtones, and right indicates highlights.
- Analyze exposure by examining peak positions, heights, and widths to assess tonal distribution.
- Identify highlight and shadow clipping at histogram edges to prevent loss of detail.
- Adjust for sky conditions and atmospheric haze using filters and post-processing techniques.
- Monitor histogram shapes in real-time to optimize dynamic range and balance exposure.
Understanding Histogram Basics
When you're diving into aerial photography, understanding histograms is essential. A histogram is a graphical representation of your image's tonal range, displaying the distribution of pixels across different brightness levels. It's a powerful tool that helps you assess exposure and contrast in your aerial shots.
You'll typically see a histogram as a graph with a horizontal axis representing brightness levels from 0 (black) to 255 (white), and a vertical axis showing the number of pixels at each level. The left side of the histogram represents shadows, the middle represents midtones, and the right side represents highlights.
To interpret a histogram, look for these key aspects:
- Overall shape: A well-exposed image usually has a balanced distribution across the graph.
- Clipping: Peaks touching the left or right edges indicate loss of detail in shadows or highlights.
- Gaps: Large empty spaces may suggest poor tonal range or excessive contrast.
Analyzing Exposure in Aerial Images
You'll find that interpreting histogram peaks is essential for evaluating exposure in aerial images.
When examining your histogram, look for spikes that indicate where most of your image's tonal values are concentrated.
Pay close attention to the far left and right edges of the histogram, as these areas can reveal highlight and shadow clipping, which may result in loss of detail in your aerial photographs.
Histogram Peaks Interpretation
Three key aspects of histogram peaks provide essential insights when analyzing exposure in aerial images.
First, the position of peaks indicates the overall brightness of your image. Left-leaning peaks suggest a darker image, while right-leaning peaks indicate a brighter one.
Second, the height of peaks reveals the concentration of pixels at specific tonal ranges. Taller peaks mean more pixels in that particular range.
Third, the width of peaks shows the tonal variety within a specific brightness level. Wider peaks indicate more diverse tones, while narrower peaks suggest a limited tonal range.
When interpreting histogram peaks, consider these four factors:
- Multiple distinct peaks may indicate high contrast or separate exposure zones
- A single central peak often represents a well-balanced exposure
- Clipped peaks at either end suggest loss of detail in shadows or highlights
- Gaps between peaks can indicate missing tonal information
Highlight and Shadow Clipping
Building on our understanding of histogram peaks, let's examine highlight and shadow clipping in aerial photography.
When analyzing your aerial images' histograms, pay close attention to the far right and left edges. These areas represent the brightest highlights and darkest shadows in your image, respectively.
Highlight clipping occurs when the histogram data abruptly stops at the right edge, indicating that some areas of your image are completely white with no detail. This often happens with bright clouds or reflective surfaces. To address this, you'll need to reduce your exposure or use graduated filters.
Shadow clipping, on the other hand, is when the histogram data stops at the left edge, signifying areas of pure black with no detail. This can occur in deep shadows or dark vegetation. To recover these areas, you'll need to increase exposure or use fill light in post-processing.
It's essential to maintain a balance between preserving highlights and shadows in aerial photography. You can use your camera's highlight and shadow warnings to identify clipped areas in real-time.
Identifying Tonal Range Issues
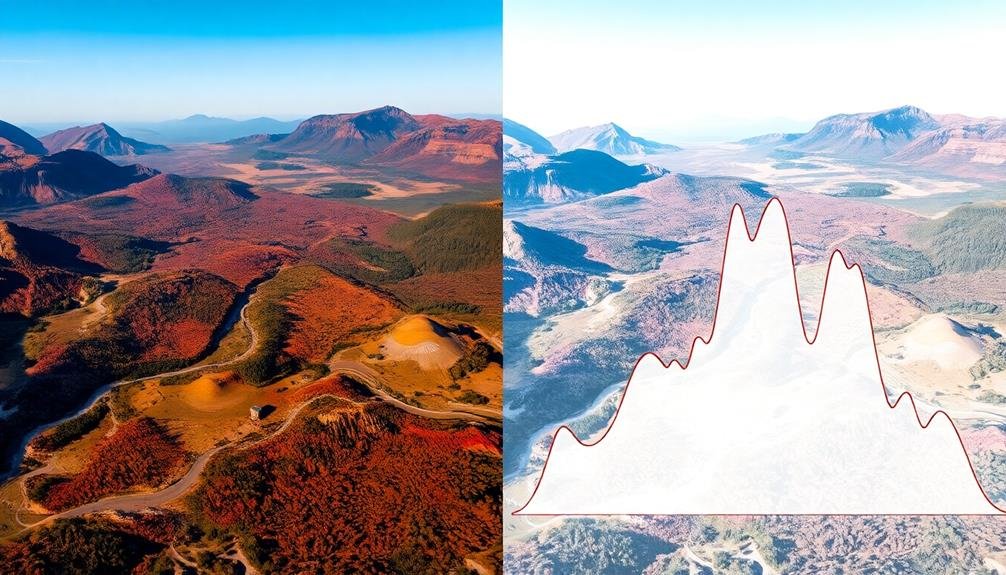
You'll often encounter tonal range issues when examining aerial photography histograms.
Look for clipped highlights and shadows, which appear as spikes at the far right and left edges of the histogram, indicating loss of detail in the brightest and darkest areas.
Additionally, pay attention to uneven tonal distribution, where gaps or concentrated clusters in the histogram suggest potential problems with image contrast and overall tonal balance.
Clipped Highlights and Shadows
When analyzing aerial photography histograms, you'll often encounter clipped highlights and shadows, which indicate tonal range issues in your images. Clipping occurs when the histogram touches either edge, showing a loss of detail in the brightest or darkest areas.
To address this problem, you'll need to adjust your exposure settings or use post-processing techniques.
To effectively manage clipped highlights and shadows:
- Check your histogram regularly during shoots to catch clipping early.
- Use exposure compensation to adjust for bright skies or dark landscapes.
- Bracket your exposures to capture a wider range of tones.
- Apply graduated neutral density filters to balance exposure in high-contrast scenes.
If you've already captured images with clipping, don't worry. You can often recover some detail in post-processing by adjusting the highlights and shadows sliders.
However, it's always best to get the exposure right in-camera. By understanding how to read your histogram and make necessary adjustments, you'll improve the overall quality of your aerial photographs and guarantee you're capturing the full range of tones in each scene.
Uneven Tonal Distribution
An uneven tonal distribution in your aerial photography histogram can reveal significant tonal range issues in your images. When you encounter this, you'll notice gaps or spikes in certain areas of the histogram, indicating an imbalance in the tonal values across your photo.
To identify these issues, look for clusters of data concentrated in specific regions of the histogram. If you see a large spike in the shadows or highlights, it might indicate underexposure or overexposure, respectively. Similarly, gaps in the mid-tones can suggest a lack of detail in those areas.
You can address uneven tonal distribution by adjusting your camera settings or post-processing techniques. Try modifying your exposure, aperture, or ISO to capture a more balanced range of tones.
In post-processing, use tools like levels, curves, or selective adjustments to redistribute the tones more evenly.
Balancing Highlights and Shadows

Often, the key to a well-balanced aerial photograph lies in properly managing highlights and shadows.
When analyzing your histogram, you'll want to verify that neither the highlights nor the shadows are clipped, which would result in loss of detail. To achieve this balance, you'll need to adjust your camera settings or post-processing techniques.
Start by examining the histogram's edges. If you see spikes at either end, it's a sign that you're losing information in the brightest or darkest areas.
To correct this, you can:
- Use graduated neutral density filters to reduce the brightness of the sky
- Bracket your exposures and blend them in post-processing
- Adjust your camera's dynamic range settings
- Utilize HDR techniques for extreme contrast situations
Adjusting for Different Sky Conditions
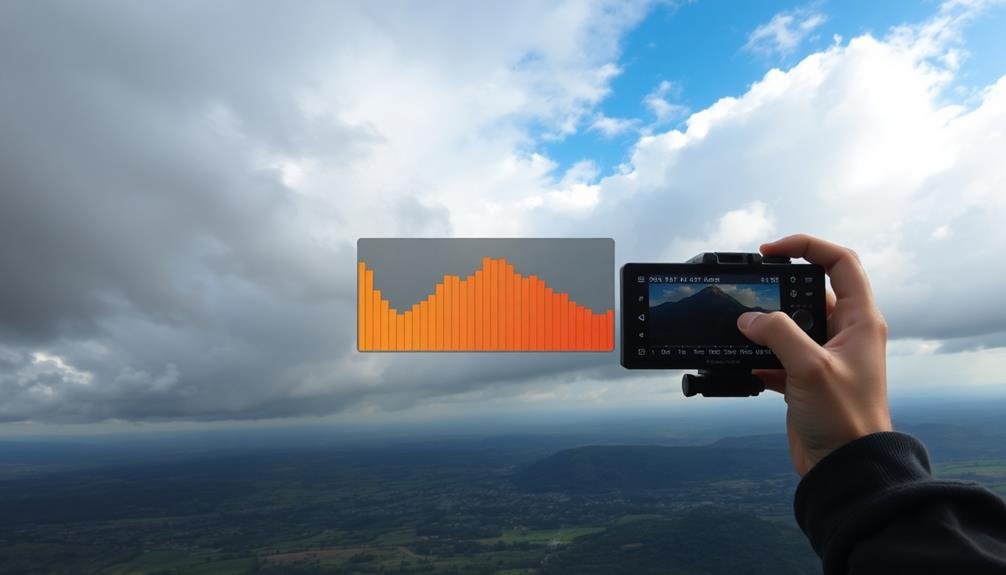
Sky conditions can make or break your aerial photography, so it's crucial to adjust your approach accordingly. When analyzing your histogram, you'll need to take into account the sky's impact on your overall exposure.
On bright, clear days, you'll often see a spike on the right side of the histogram, representing the sky's highlights. To balance this, you may need to underexpose slightly or use graduated neutral density filters.
For overcast conditions, your histogram will likely show a more even distribution. You'll want to pay attention to the midtones and shadows, ensuring they're not too dark or flat. In these situations, think about increasing contrast and adjusting the white balance to combat the gray cast.
During golden hour or sunset shoots, your histogram might display two distinct peaks: one for the sky and another for the landscape. To capture both effectively, you may need to bracket your exposures or use HDR techniques.
Compensating for Atmospheric Haze
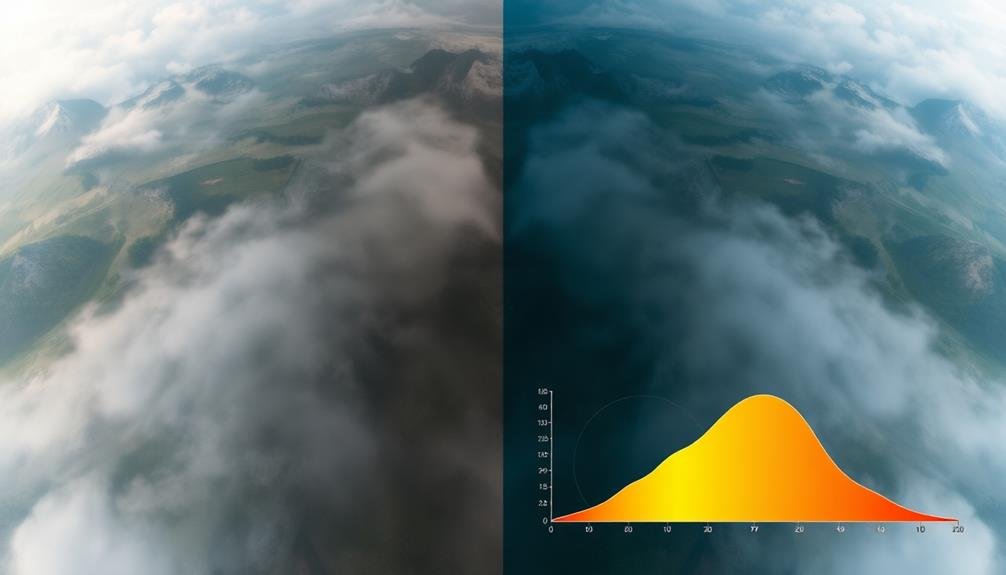
When shooting from high altitudes, atmospheric haze can considerably impact your aerial photographs, affecting both contrast and color. To compensate for this issue, you'll need to adjust your camera settings and post-processing techniques.
Start by using a polarizing filter to reduce haze and improve contrast. In post-processing, you can further enhance your images by adjusting levels, contrast, and saturation.
To effectively compensate for atmospheric haze, follow these key steps:
- Increase contrast: Use the contrast slider or curves adjustment to bring out details lost in the haze.
- Adjust levels: Move the black point slightly to the right to deepen shadows and improve overall contrast.
- Boost saturation: Carefully increase color saturation to counteract the washed-out effect of haze.
- Apply local adjustments: Use masks or brushes to target specific areas affected by haze.
Remember that histograms play a significant role in this process. They'll help you identify the impact of haze on your image's tonal range and guide your adjustments.
Pay close attention to the histogram's shape and distribution as you make changes, ensuring you don't clip highlights or shadows while compensating for haze.
Optimizing Dynamic Range
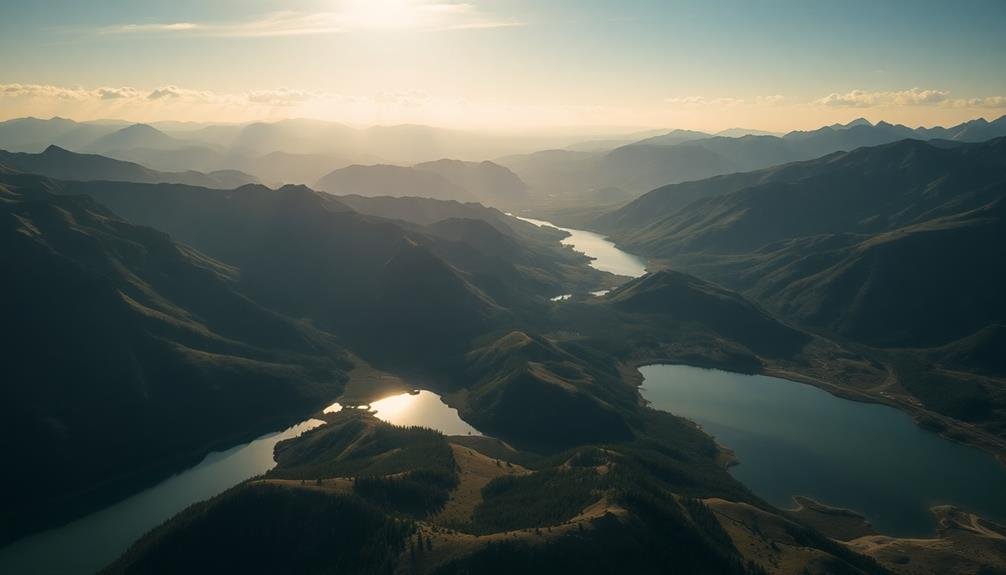
Maximizing the dynamic range of your aerial photographs is essential for capturing the full spectrum of tones from the brightest highlights to the darkest shadows. To optimize dynamic range, start by shooting in RAW format, which preserves more data than JPEG.
Utilize your camera's histogram to guarantee you're not clipping highlights or shadows. Aim for a balanced exposure, with the histogram spread across the entire range without touching the edges.
When dealing with high-contrast scenes, consider using exposure bracketing. Take multiple shots at different exposures and blend them in post-processing. This technique allows you to capture details in both bright skies and shadowy terrain.
You can also use graduated neutral density filters to balance exposure between bright skies and darker ground elements.
In post-processing, use the levels and curves tools to fine-tune your image's tonal range. Adjust the black and white points to maximize contrast without losing detail.
Don't be afraid to use local adjustments to bring out details in specific areas. Finally, consider using HDR techniques for extremely high-contrast scenes, but be careful not to overprocess and create unnatural-looking images.
Histogram Shapes and Their Meanings
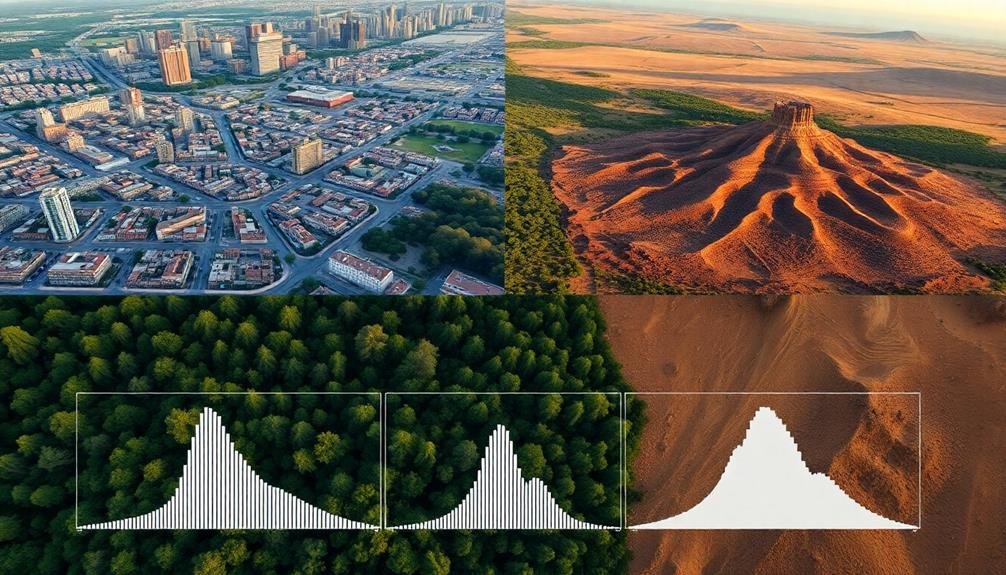
A histogram's shape reveals essential information about your aerial photograph's tonal distribution. Understanding these shapes can help you quickly assess and adjust your images for ideal results. Each shape corresponds to a specific tonal characteristic, allowing you to make informed decisions about exposure and post-processing.
Here are four common histogram shapes and their meanings:
- Bell curve: Indicates a well-balanced image with a good distribution of tones across the spectrum.
- Left-skewed: Suggests a darker image with more shadows and potentially underexposed areas.
- Right-skewed: Implies a brighter image with more highlights and possible overexposure.
- U-shaped: Represents high contrast with prominent shadows and highlights but fewer midtones.
When analyzing your aerial photograph's histogram, pay attention to clipping at either end. If the graph touches the left or right edge, you're losing detail in shadows or highlights, respectively.
Aim for a balanced distribution that captures the full range of tones in your scene. Remember, there's no perfect histogram shape – it depends on your subject and creative intent. Use the histogram as a tool to guide your decisions and guarantee you're capturing the desired tonal range for your aerial photography.
Real-time Histogram Monitoring Techniques
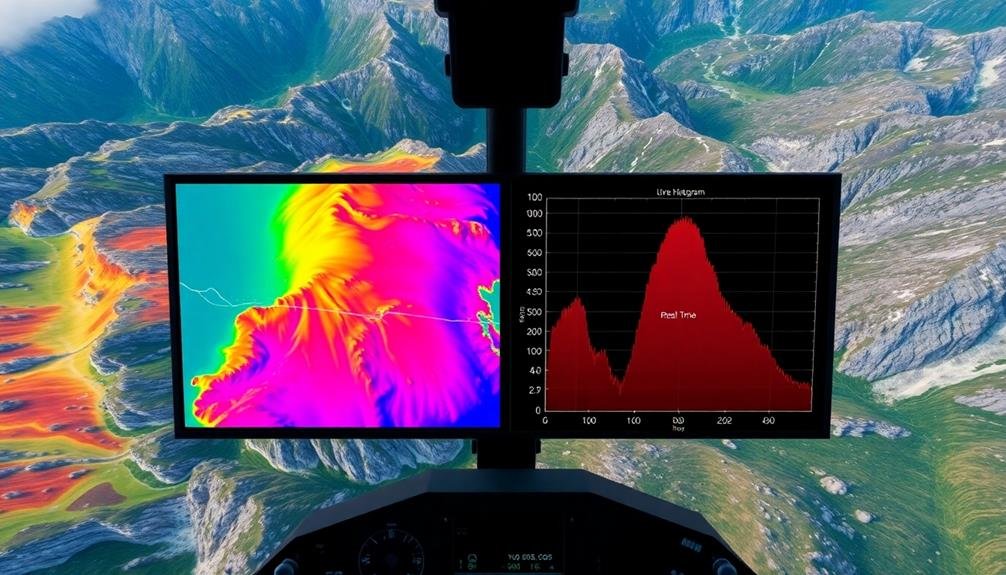
Throughout your aerial photography sessions, real-time histogram monitoring can be a game-changer. It allows you to instantly assess and adjust your exposure settings, ensuring you capture ideal images. To effectively monitor histograms in real-time, you'll need to familiarize yourself with your camera's live view mode or electronic viewfinder.
Keep an eye on the histogram's overall shape and distribution. If you notice clipping on either end, adjust your exposure accordingly. Don't forget to take into account your subject matter and lighting conditions when interpreting the histogram. Here's a quick reference guide for real-time histogram monitoring:
| Histogram Feature | What It Means | Action to Take |
|---|---|---|
| Left-side clipping | Underexposure | Increase exposure |
| Right-side clipping | Overexposure | Decrease exposure |
| Centered peak | Balanced exposure | Maintain settings |
| Multiple peaks | High contrast | Consider HDR |
| Flat distribution | Low contrast | Adjust contrast |
Frequently Asked Questions
How Do Camera Sensor Types Affect Histogram Interpretation in Aerial Photography?
You'll find that different camera sensor types impact histogram interpretation in aerial photography. CCD sensors often produce smoother histograms, while CMOS sensors may show more noise. You'll need to adjust your analysis based on the sensor used.
Can Histograms Help Identify Issues With Drone Vibration or Motion Blur?
Yes, histograms can help you spot vibration or motion blur issues. You'll notice a loss of sharp peaks and broader, flatter distributions. If you're seeing these patterns consistently, it's time to check your drone's stability.
What Role Do Color Spaces Play in Histogram Analysis for Aerial Images?
You'll find color spaces essential in histogram analysis for aerial images. They'll affect how you interpret color distribution and exposure. RGB, HSL, and LAB spaces can reveal different insights about your image's tonal range and color balance.
How Do Different Altitudes Impact Histogram Readings in Aerial Photography?
As you increase altitude, you'll notice histogram peaks shift and spread. Higher altitudes often flatten the histogram, reducing contrast. Lower altitudes typically result in more pronounced peaks and valleys, capturing more detail and texture.
Are There Specific Histogram Patterns That Indicate Potential Equipment Malfunctions During Flights?
You'll notice unusual spikes, gaps, or extreme skewing in your histogram that don't match your scene. These can signal equipment issues like sensor damage, lens malfunctions, or incorrect camera settings during your flight.
In Summary
You've now accessed the power of histograms for aerial photography. By applying these key tips, you'll confidently assess exposure, balance tones, and overcome atmospheric challenges. Remember to monitor your histogram in real-time and adjust accordingly. With practice, you'll intuitively read histogram shapes and optimize your images' dynamic range. Don't be afraid to experiment – your aerial shots will improve dramatically as you master this essential tool. Keep pushing your boundaries and elevating your aerial photography skills.

As educators and advocates for responsible drone use, we’re committed to sharing our knowledge and expertise with aspiring aerial photographers.


Leave a Reply