To map urban solar potential from above, you'll need to choose the right drone with high-resolution cameras and optimize your flight planning. Calibrate sensors for accuracy and capture detailed imagery on clear days. Process your data using GIS software to analyze roof structures and assess shading factors. Calculate solar irradiance and evaluate building energy consumption to create interactive solar maps. Don't forget to take into account local regulations and obtain necessary permits for urban drone flights. By following these tips, you'll be well-equipped to revolutionize your city's renewable energy planning. Dive deeper to access the full potential of urban solar mapping.
Choose the Right Drone

When it comes to mapping urban solar potential, selecting the appropriate drone is vital. You'll need a model that can handle the specific demands of urban environments and solar mapping.
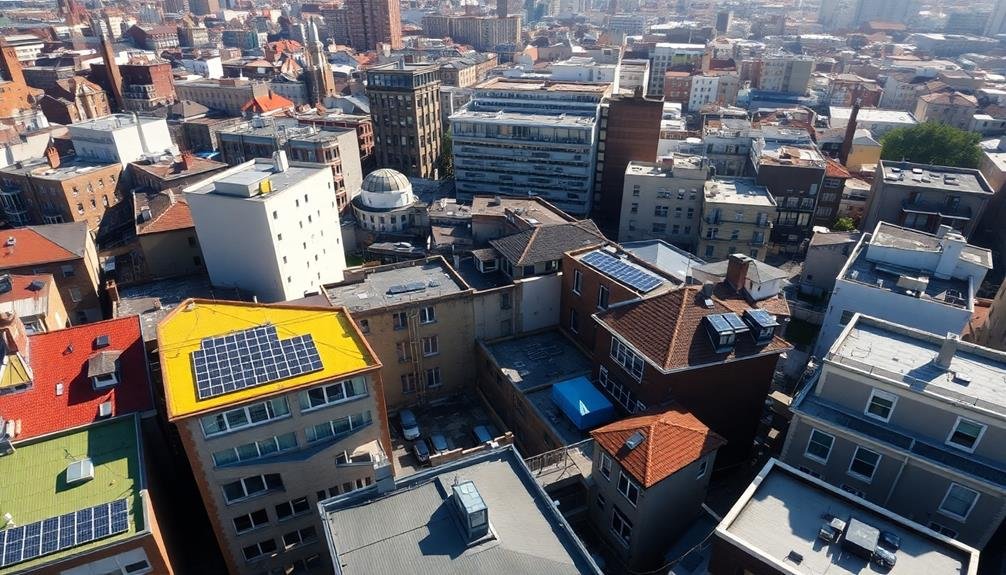
Look for drones with high-resolution cameras, ideally 20 megapixels or more, to capture detailed rooftop images. Thermal cameras are also valuable for identifying heat signatures and potential panel placement.
Consider flight time and range when choosing your drone. Urban mapping often requires covering large areas, so opt for models with at least 30 minutes of flight time. GPS-enabled drones with obstacle avoidance systems are essential for traversing complex cityscapes safely.
Don't overlook payload capacity. You might need to carry additional sensors or equipment, so choose a drone that can handle the extra weight. Weather resistance is another key factor, as you'll likely encounter various conditions during your mapping missions.
Lastly, verify your chosen drone complies with local regulations for urban flight. Some areas may have restrictions on drone use, so select a model that meets these requirements while still delivering the performance you need for effective solar potential mapping.
Optimize Flight Planning

Once you've selected the right drone, enhancing your flight planning becomes essential for efficient urban solar potential mapping.
You'll need to take into account factors like flight altitude, speed, and path to guarantee thorough coverage and high-quality data collection. Start by analyzing the urban area you're mapping, taking note of building heights, obstacles, and restricted airspace.
To maximize efficiency and data quality, follow these key steps:
- Set the ideal flight altitude: Balance between coverage area and image resolution. Higher altitudes cover more ground but may sacrifice detail.
- Plan overlapping flight paths: Ensure at least 60-70% overlap between images for accurate 3D reconstruction and solar potential analysis.
- Account for weather conditions: Schedule flights during clear, calm days to minimize shadows and wind interference.
Don't forget to comply with local drone regulations and obtain necessary permits.
Think about using flight planning software to automate the process and enhance your routes. By carefully planning your flights, you'll collect more accurate data in less time, leading to better solar potential assessments for urban areas.
Calibrate Sensors for Accuracy
To guarantee accurate solar potential mapping, you'll need to calibrate your sensors properly.
Follow sensor calibration best practices, including regular checks and adjustments to maintain precision over time.
You can verify accuracy through comparison with ground-based measurements and cross-referencing with other calibrated instruments.
Sensor Calibration Best Practices
For accurate urban solar potential mapping, proper sensor calibration is vital. You'll need to guarantee your sensors are correctly calibrated before each flight to capture reliable data.
Start by checking the manufacturer's guidelines for your specific sensor model, as calibration procedures can vary. It's essential to perform calibration in conditions similar to those you'll encounter during your mapping missions.
When calibrating your sensors, focus on these key aspects:
- Spectral calibration: Adjust your sensors to accurately measure different wavelengths of light, guaranteeing precise detection of solar radiation.
- Radiometric calibration: Calibrate your sensors to measure the intensity of radiation correctly, allowing for accurate quantification of solar energy potential.
- Geometric calibration: Align your sensors to capture accurate spatial information, enabling precise mapping of urban structures and their solar potential.
Don't forget to recalibrate your sensors regularly, especially after transport or significant temperature changes.
Accuracy Verification Techniques
After calibrating your sensors, it's crucial to verify their accuracy before conducting urban solar potential mapping. Use a combination of techniques to guarantee your data is reliable.
Start by comparing your sensor readings to known reference values or standards. This can include measuring solar irradiance at specific times and locations with well-documented solar intensity.
Perform cross-validation by using multiple sensors to measure the same area and compare results. Any significant discrepancies should be investigated and resolved.
You'll also want to conduct ground-truth measurements, where you physically verify sensor data with on-site observations and handheld devices.
Don't forget to assess your sensors' performance under various environmental conditions, such as different weather patterns or times of day. This will help you understand their limitations and potential sources of error.
Regularly analyze your data for consistency and look for any anomalies or unexpected patterns that might indicate sensor inaccuracies.
Capture High-Resolution Imagery

How do you obtain the detailed imagery needed for accurate solar potential mapping? It's vital to capture high-resolution aerial or satellite images of the urban area you're analyzing. These images serve as the foundation for identifying potential solar installation sites and calculating their energy generation capacity.
To guarantee you're working with the best possible data:
- Use aerial photography or LiDAR technology to capture images with a resolution of at least 15-30 cm per pixel. This level of detail allows you to identify individual roof features, such as chimneys, vents, and skylights.
- Schedule image capture during ideal weather conditions. Clear, sunny days with minimal cloud cover provide the best results. Avoid seasons with heavy foliage that might obstruct roof views.
- Employ georeferencing techniques to align your imagery with precise GPS coordinates. This step is essential for accurate measurements and integration with other geospatial data sources.
Process Data With GIS Software
With your high-resolution imagery in hand, it's time to plunge into processing the data using Geographic Information System (GIS) software. You'll need to import your aerial or satellite images into your chosen GIS platform, such as QGIS or ArcGIS.
Once imported, georeference the images to align them with real-world coordinates.
Next, you'll create vector layers to outline building rooftops. Use automated feature extraction tools or manually digitize the rooftops, depending on your software capabilities and data quality.
After defining the rooftops, calculate their area and slope using built-in GIS tools.
To assess solar potential, you'll need to factor in solar radiation data. Import solar irradiance maps for your area or use solar radiation modeling tools within your GIS software.
Combine this data with your rooftop information to estimate the solar energy potential for each building.
Don't forget to account for shading from nearby structures or vegetation. Use 3D modeling tools or LiDAR data, if available, to create a digital surface model and perform shadow analysis.
This will help you refine your solar potential estimates and identify the most suitable areas for solar panel installation.
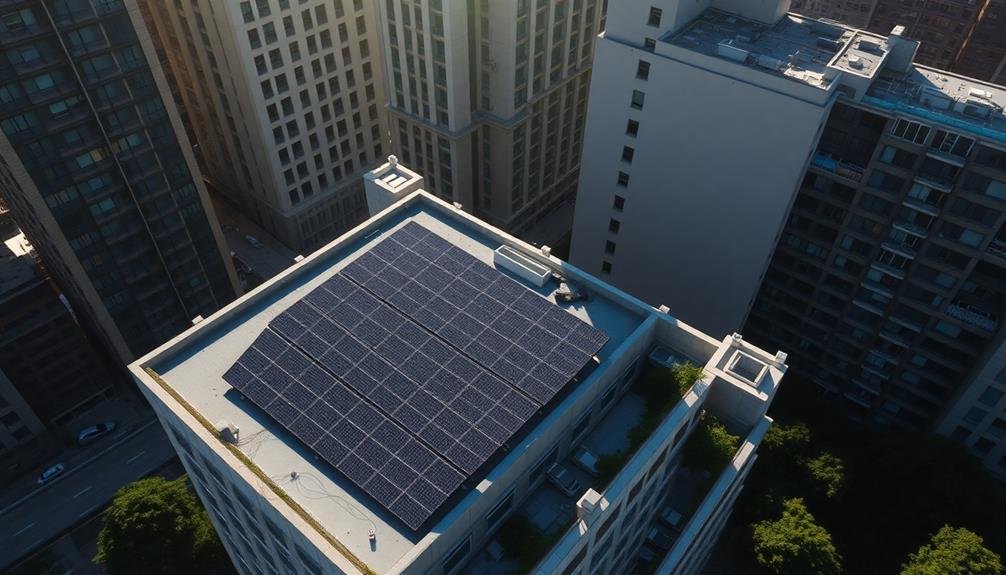
Analyze Roof Structures

Three key aspects come into play when analyzing roof structures for solar potential: orientation, pitch, and obstructions. You'll want to focus on south-facing roofs in the Northern Hemisphere, as they receive the most sunlight throughout the year.
Ideal roof pitches for solar panels typically range from 30 to 45 degrees, but this can vary depending on your latitude. Obstructions like chimneys, vents, or nearby trees can greatly impact a roof's solar potential.
When analyzing roof structures, you'll need to:
- Use high-resolution aerial imagery to identify roof shapes and orientations
- Calculate roof slopes using digital elevation models (DEMs) or LiDAR data
- Detect and map potential obstructions that could cast shadows on the panels
It's essential to take into account the structural integrity of the roof as well. You'll need to assess whether it can support the additional weight of solar panels and mounting equipment.
Don't forget to factor in local building codes and regulations that might affect solar installations. By thoroughly analyzing roof structures, you'll be able to create accurate maps of urban solar potential, helping city planners and homeowners make informed decisions about solar energy adoption.
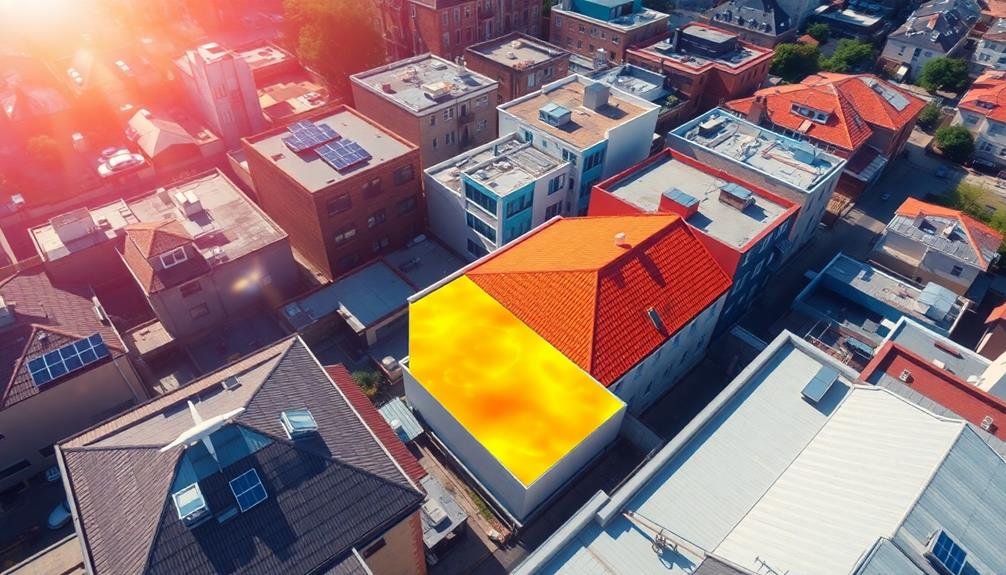
Account for Shading Factors
Throughout the day, shading factors play an essential role in determining a roof's solar potential. You'll need to take into account both temporary and permanent sources of shade when mapping urban solar potential. Trees, neighboring buildings, and architectural features can all cast shadows that greatly impact solar panel efficiency.
To account for shading factors, you should use advanced 3D modeling software that simulates sun paths throughout the year. This will help you identify areas that receive consistent sunlight and those that are frequently shaded.
Don't forget to factor in seasonal changes, as the sun's position varies throughout the year. You'll also want to analyze nearby vegetation, particularly deciduous trees that may provide more shade in summer than winter.
Take into account future growth projections for trees and potential new construction in the area that could impact shading. For the most accurate results, you should conduct on-site assessments using tools like solar pathfinders or shade analysis devices.
These instruments can provide detailed information about shading patterns specific to each roof location, helping you make more informed decisions about solar panel placement and overall system design.
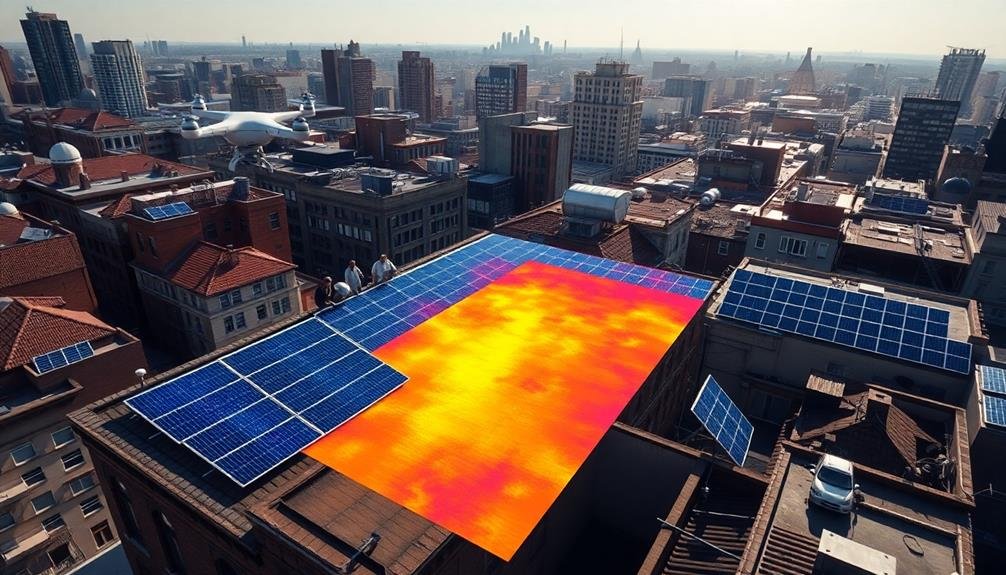
Calculate Solar Irradiance

Solar irradiance calculation forms the backbone of accurate urban solar potential mapping. You'll need to determine the amount of solar energy reaching each surface in your study area. This process involves considering the sun's position throughout the year and how it interacts with the local topography and built environment.
To calculate solar irradiance effectively, you should:
- Utilize solar radiation models that account for atmospheric conditions, latitude, and time of year.
- Incorporate digital elevation models (DEMs) to factor in terrain effects on solar exposure.
- Apply algorithms that consider surface orientation, including roof pitch and direction.
You'll want to use specialized GIS software or custom scripts to process this data. These tools can help you generate solar radiation maps for different time periods, from hourly to annual scales.
Don't forget to account for diffuse and reflected radiation, not just direct sunlight. It's essential to validate your calculations with ground-based measurements when possible.
Assess Building Energy Consumption
To assess building energy consumption, you'll need to analyze energy usage patterns across the urban landscape.
You can identify high-consumption buildings by examining utility data and comparing energy use intensities.
Calculate per-capita energy usage to understand how individual behavior impacts overall consumption and to pinpoint areas for potential improvement.
Analyze Energy Usage Patterns
A city's energy consumption patterns hold the key to revealing its solar potential. By analyzing these patterns, you'll gain valuable insights into where solar installations can make the most impact.
Start by examining historical energy usage data for different buildings and neighborhoods. Look for trends in peak consumption hours and seasonal variations. This information will help you identify areas with high daytime energy demands, which are prime candidates for solar power integration.
Consider the following factors when analyzing energy usage patterns:
- Time-of-use data: Examine when buildings consume the most electricity throughout the day. Areas with high daytime usage are well-suited for solar installations.
- Seasonal fluctuations: Assess how energy consumption changes across seasons. This helps in determining the best size and orientation of solar panels.
- Building type and function: Different structures have unique energy needs. Commercial buildings often have higher daytime consumption, making them excellent candidates for solar power.
Identify High-Consumption Buildings
Pinpointing energy-hungry structures is an essential step in mapping urban solar potential. You'll need to gather and analyze data on building energy consumption to identify the highest consumers. Start by obtaining utility records, which often provide detailed information on electricity usage for individual buildings. If these aren't available, you can estimate consumption based on building size, type, and occupancy.
Look for patterns in energy use, such as spikes during certain times of day or seasons. Pay attention to large commercial buildings, data centers, and industrial facilities, as they're typically high energy consumers. Don't overlook older buildings with inefficient systems, as they may use more energy than modern structures.
Use geographic information systems (GIS) to map and visualize energy consumption data. This will help you quickly spot areas with concentrated high-consumption buildings.
Consider factors like roof size, orientation, and shading when evaluating solar potential for these structures. By identifying high-consumption buildings, you'll prioritize locations where solar installations can have the most significant impact on reducing grid energy demand and lowering carbon emissions.
Calculate Per-Capita Energy Usage
Calculating per-capita energy usage offers a more nuanced view of building energy consumption. It allows you to compare buildings of different sizes and occupancy levels more accurately. To calculate this metric, you'll need to gather data on both total energy consumption and the number of occupants for each building.
Start by obtaining energy consumption data from utility companies or building management systems. This information should cover at least a year to account for seasonal variations. Next, determine the average number of occupants in each building, including residents, employees, and regular visitors. Divide the total energy consumption by the number of occupants to get the per-capita energy usage.
Consider these factors when analyzing per-capita energy usage:
- Building type and function (e.g., residential, commercial, industrial)
- Occupancy patterns and hours of operation
- Energy-intensive equipment or processes specific to certain buildings
Use this information to identify buildings with unusually high per-capita energy consumption. These structures may have inefficient systems or practices that could benefit from energy-saving interventions.
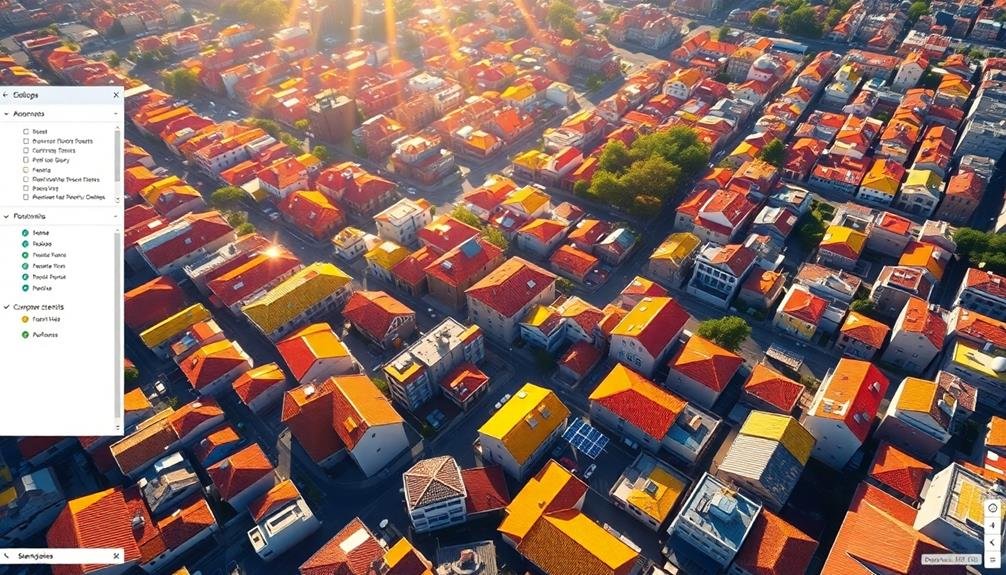
Create Interactive Solar Maps

Interactive solar maps bring urban solar potential to life, allowing users to explore and visualize solar data in dynamic ways.
To create these maps, you'll need to combine your collected solar data with geospatial information and user-friendly interfaces.
Start by integrating your solar potential calculations with a mapping platform like Google Maps or Mapbox. Layer your data onto satellite imagery, showing rooftop solar potential across the city. Use color-coding to indicate varying levels of solar suitability, making it easy for users to identify prime locations at a glance.
Add interactive features that let users click on specific buildings to view detailed information. Include estimated energy generation, potential cost savings, and environmental impact. Incorporate filters that allow users to sort by factors like roof size, orientation, or shading.
Don't forget to make your map mobile-responsive, ensuring accessibility across devices. Consider adding augmented reality features that let users visualize solar panels on their own roofs through their smartphone cameras.
Frequently Asked Questions
How Does Weather Affect Urban Solar Potential Mapping Accuracy?
Weather notably impacts your urban solar potential mapping accuracy. Cloud cover, rain, and seasonal changes affect solar radiation measurements. You'll get less precise results on overcast days, so it's best to map during clear weather conditions.
What Legal Permissions Are Required for Drone-Based Solar Mapping?
You'll need FAA approval for commercial drone operations, including a Part 107 remote pilot certificate. Local permits may be required. Check privacy laws, as you're capturing rooftop images. Always obtain property owners' consent before flying.
Can This Technology Be Used for Residential Solar Panel Installation Planning?
Yes, you can use drone-based solar mapping for residential installations. It'll help you assess roof conditions, shading, and ideal panel placement. You'll get accurate measurements and data to plan efficient, customized solar systems for homes.
How Often Should Urban Solar Potential Maps Be Updated?
You should update urban solar potential maps every 3-5 years. Changes in building structures, tree growth, and new constructions can affect solar exposure. Regular updates guarantee you're using accurate data for solar planning and installations.
What Are the Cost Implications of Implementing Large-Scale Urban Solar Mapping Projects?
You'll find large-scale urban solar mapping projects can be costly. They'll require significant investments in data collection, processing, and analysis. However, you'll see long-term benefits through improved solar planning and increased renewable energy adoption.
In Summary
You've now got the tools to map urban solar potential from above. By selecting the right drone, optimizing your flights, and processing data accurately, you'll create valuable solar maps. Don't forget to account for shading and energy consumption. With these tips, you're ready to revolutionize urban solar planning. Your maps will help cities harness the sun's power more effectively, leading to greener, more sustainable communities. Keep innovating and pushing the boundaries of solar mapping technology.
As educators and advocates for responsible drone use, we’re committed to sharing our knowledge and expertise with aspiring aerial photographers.

Leave a Reply