To spot crop diseases from above, you'll need to master aerial surveillance techniques using drones or satellites equipped with specialized sensors. Focus on multispectral and thermal imaging to detect plant stress and disease symptoms. Establish regular monitoring schedules, ideally in early morning hours, and use grid or spiral flight patterns for thorough coverage. Familiarize yourself with healthy crop patterns and common disease signatures, including discoloration, growth abnormalities, and leaf damage. Utilize data processing tools to analyze imagery and create vegetation index maps. By integrating these methods with ground truthing, you'll revolutionize your crop management and protect your yields more effectively.
Understanding Aerial Crop Disease Detection

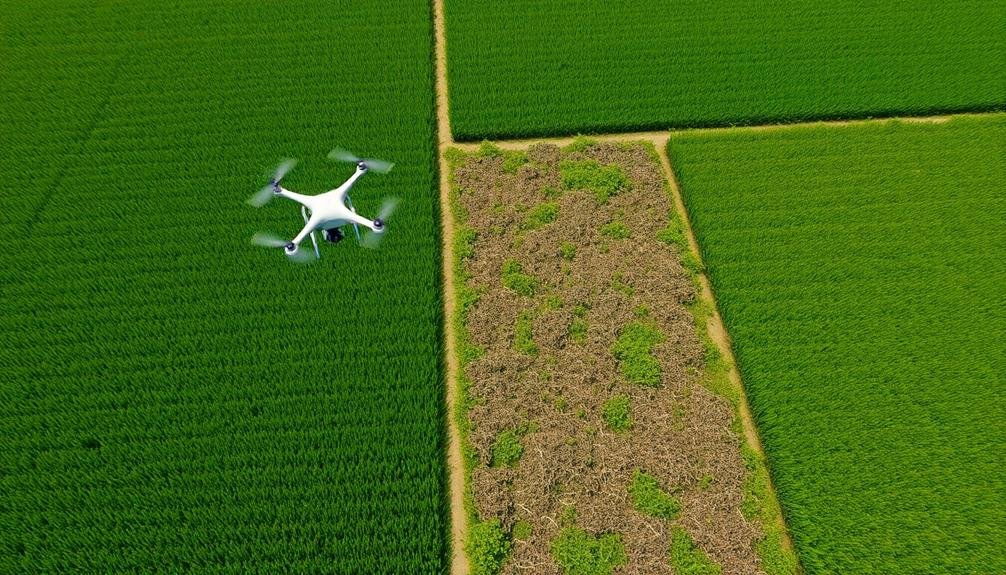
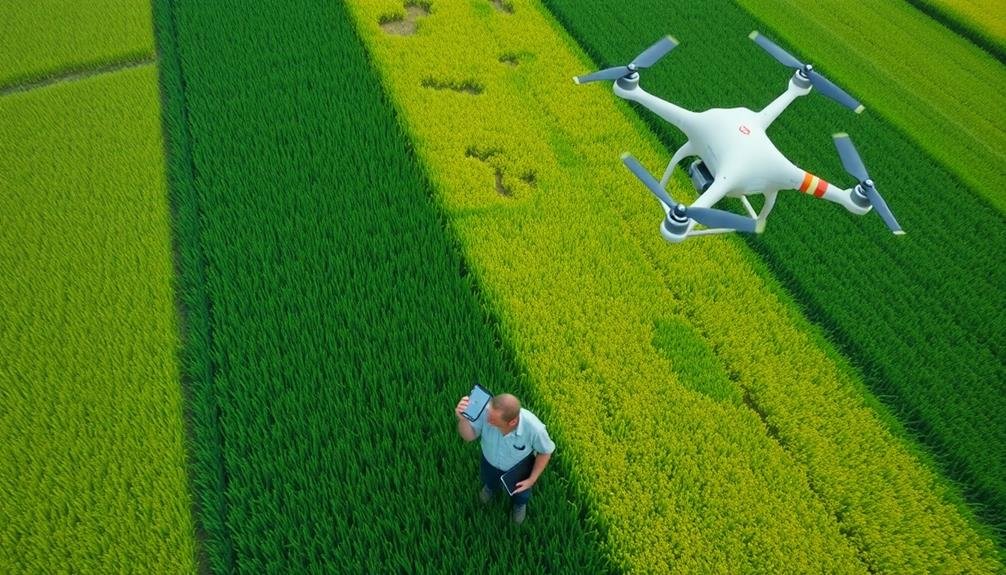
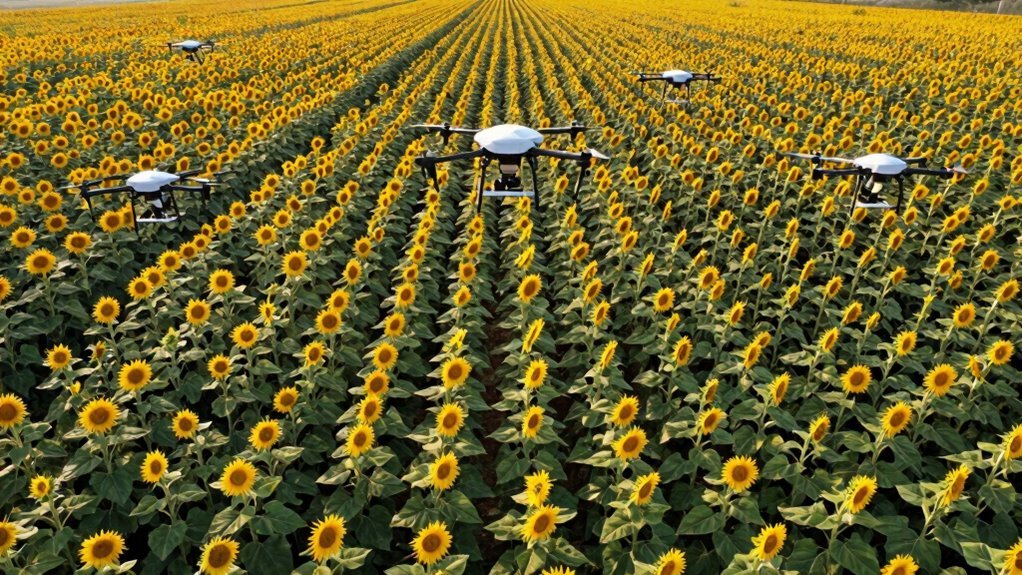
Aerial surveillance has revolutionized crop disease detection. By using drones, satellites, and aircraft equipped with specialized sensors, you can now identify crop health issues across large areas quickly and efficiently. These technologies allow you to spot signs of disease before they're visible to the naked eye on the ground.
To understand aerial crop disease detection, you'll need to familiarize yourself with different types of imaging. Multispectral and hyperspectral sensors capture light reflectance across various wavelengths, revealing plant stress and disease symptoms. Thermal imaging detects temperature variations, which can indicate water stress or fungal infections.
You'll also need to learn how to interpret the data collected. Vegetation indices like NDVI (Normalized Difference Vegetation Index) help quantify plant health by measuring chlorophyll content. Machine learning algorithms can analyze these images to identify patterns associated with specific diseases.
When implementing aerial detection, consider factors like flight altitude, time of day, and weather conditions. These variables can affect image quality and data accuracy.
Regular calibration of sensors and ground-truthing are essential for reliable results. By mastering these techniques, you'll be able to detect crop diseases early and take timely action to protect your yields.
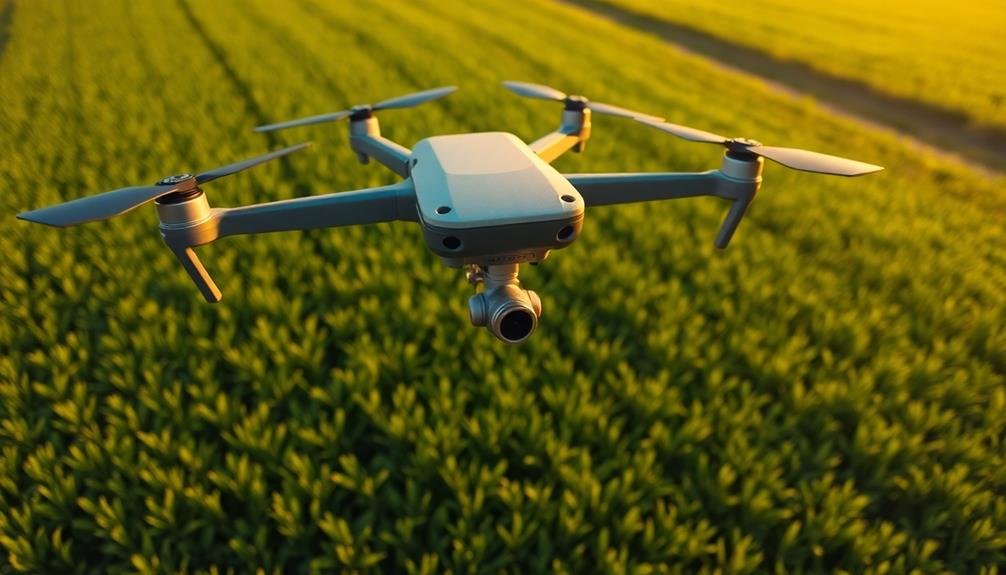
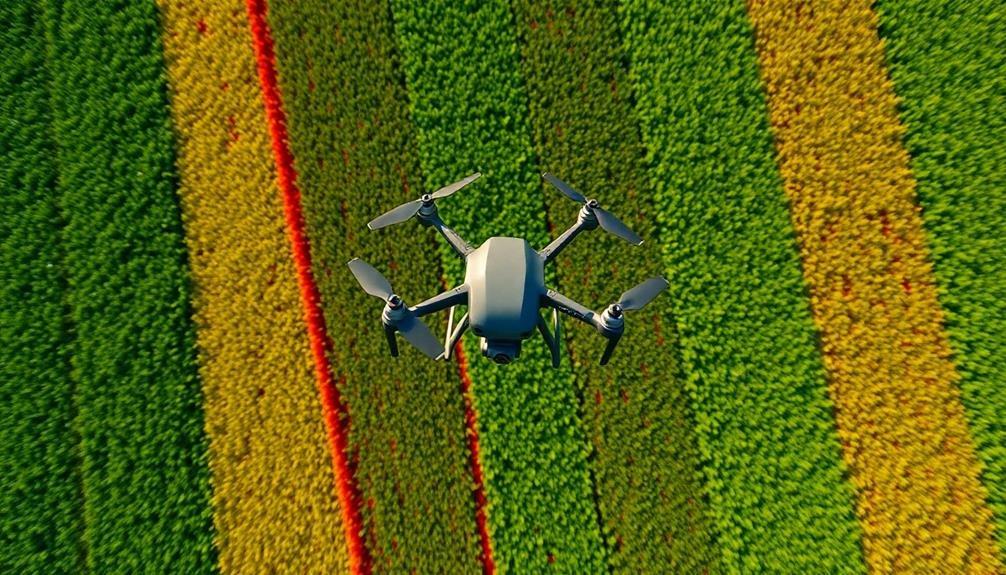
Essential Drone Equipment for Agriculture

To effectively spot crop diseases using drones, you'll need to equip your aerial device with the right tools.
Your drone should have a high-quality camera and appropriate sensors, such as multispectral or thermal imaging systems, to capture detailed crop data.
You'll also want to take into account the drone's battery life for extended flights and guarantee it's built with durability and weatherproofing to withstand various agricultural environments.
Camera and Sensor Types
Three key camera and sensor types are essential for effective agricultural drone use.
First, you'll need a high-resolution RGB camera, which captures visible light in red, green, and blue wavelengths. This camera allows you to see your crops in natural color, helping you identify obvious issues like pest damage or discoloration.
Next, consider a multispectral camera. It captures light beyond the visible spectrum, including near-infrared (NIR) wavelengths. This technology enables you to assess plant health by measuring chlorophyll content and creating vegetation indices like NDVI (Normalized Difference Vegetation Index).
Lastly, don't overlook thermal cameras. They detect heat signatures emitted by plants and soil, helping you identify irrigation issues, assess crop stress, and even spot early signs of disease before they're visible to the naked eye.
When selecting these sensors, consider factors like resolution, spectral bands, and compatibility with your drone and analysis software.
Higher resolution sensors provide more detailed images but may increase costs and data processing time. Choose sensors that balance your needs for accuracy, efficiency, and budget constraints to optimize your crop monitoring capabilities.
Battery Life Considerations
While selecting the right cameras and sensors is important, you'll also need to contemplate the power that keeps your drone aloft.
Battery life is a vital factor in agricultural drone operations, as it directly impacts your ability to cover large areas and collect thorough data. Most consumer drones offer flight times between 20 to 30 minutes, which may not be sufficient for extensive crop monitoring.
You'll want to invest in drones with longer flight times, typically 40 minutes or more, to maximize efficiency. Consider carrying spare batteries to extend your mission duration without returning to base.
Battery capacity isn't the only consideration. Factor in weather conditions, as wind resistance and temperature extremes can drain power more quickly.
You'll also need to account for the energy consumption of your payload, such as multispectral cameras or thermal sensors.
To optimize battery performance, plan your flight paths efficiently, minimizing unnecessary movements. Use automated flight planning software to create the most energy-efficient routes.
Additionally, invest in high-quality chargers and follow proper battery maintenance procedures to guarantee longevity and reliable performance in the field.
Durability and Weatherproofing
Agricultural drones must stand up to harsh conditions in the field, so durability and weatherproofing are essential factors to evaluate when selecting your equipment.
Look for drones with robust, impact-resistant frames made from materials like carbon fiber or reinforced polymers. These materials offer strength without adding excessive weight, which is vital for maintaining flight performance.
Confirm your drone has an IP (Ingress Protection) rating that indicates its resistance to dust and water. An IP54 rating or higher is ideal for agricultural use, protecting against dust ingress and water splashes from all directions.
Pay attention to sealed compartments for batteries and electronics, as these are particularly vulnerable to moisture damage.
Consider drones with corrosion-resistant components, especially if you'll be operating in coastal areas or regions with high humidity. UV-resistant coatings can also help protect your drone from prolonged sun exposure.
Don't forget about the controller and other accessories – they should be equally rugged and weatherproof.
Removable propellers and easily replaceable parts can extend your drone's lifespan and minimize downtime for repairs.
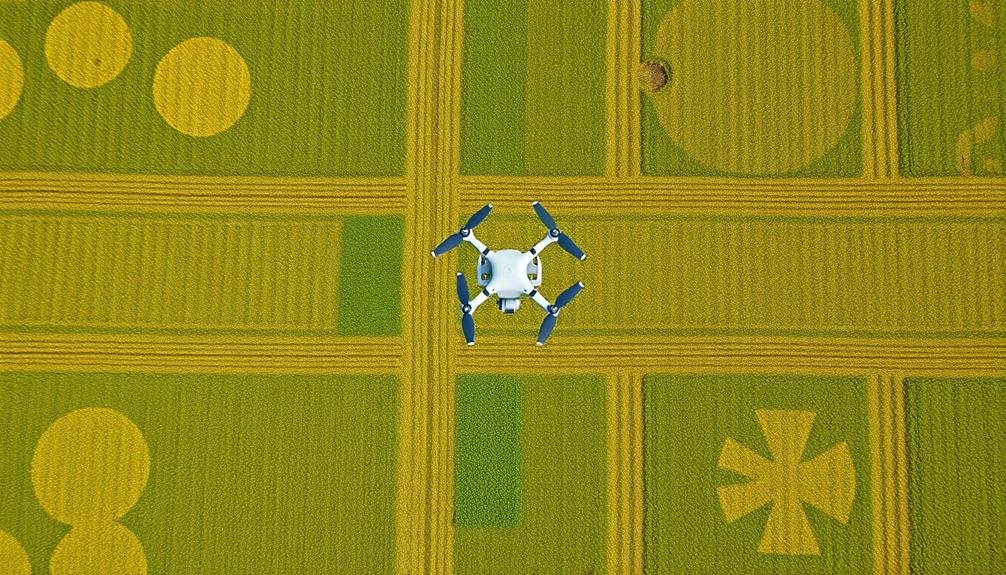
Ideal Flight Patterns for Monitoring

Effective crop disease monitoring relies on carefully planned flight patterns. You'll want to take into account several factors when designing your aerial survey route. First, determine the size and shape of your field. For rectangular plots, a simple grid pattern works well, with parallel flight lines spaced evenly across the area. If you're dealing with irregularly shaped fields, think about using a spiral pattern starting from the center and moving outward.
Altitude is vital for image quality and coverage. Fly lower for detailed inspections of specific areas, typically between 50-100 feet. For broader surveys, increase your altitude to 300-400 feet. Maintain a consistent speed, usually between 10-15 mph, to guarantee uniform image capture.
Overlap your flight paths by 60-75% to ensure complete coverage and allow for image stitching later. Time your flights for ideal lighting conditions, typically early morning or late afternoon when shadows are minimal. Avoid midday flights when glare can obscure details.
If possible, conduct multiple flights over time to track disease progression. By following these guidelines, you'll maximize the effectiveness of your aerial crop disease monitoring efforts.
Optimal Time for Aerial Surveys
To maximize the effectiveness of your aerial surveys for crop disease detection, timing is essential. You'll want to conduct your flights when disease symptoms are most visible and before they've caused irreversible damage. Typically, early to mid-morning is ideal, as the sun's angle enhances contrast and reduces shadows, making it easier to spot discoloration or unusual patterns.
Consider these factors when planning your aerial surveys:
- Weather conditions: Clear, calm days provide the best visibility and stability for your drone or aircraft.
- Growth stage: Survey during critical growth stages when plants are most susceptible to diseases.
- Seasonal patterns: Be aware of common disease outbreaks in your region and time surveys accordingly.
You'll also want to establish a regular monitoring schedule. Weekly or bi-weekly surveys can help you catch issues early, but adjust based on your crop's specific needs and known disease risks.
Remember, consistency is key. By conducting surveys at the same time of day and under similar conditions, you'll be better equipped to spot changes and anomalies.
Don't wait until you suspect a problem – regular monitoring can help you stay ahead of potential outbreaks and protect your yield.
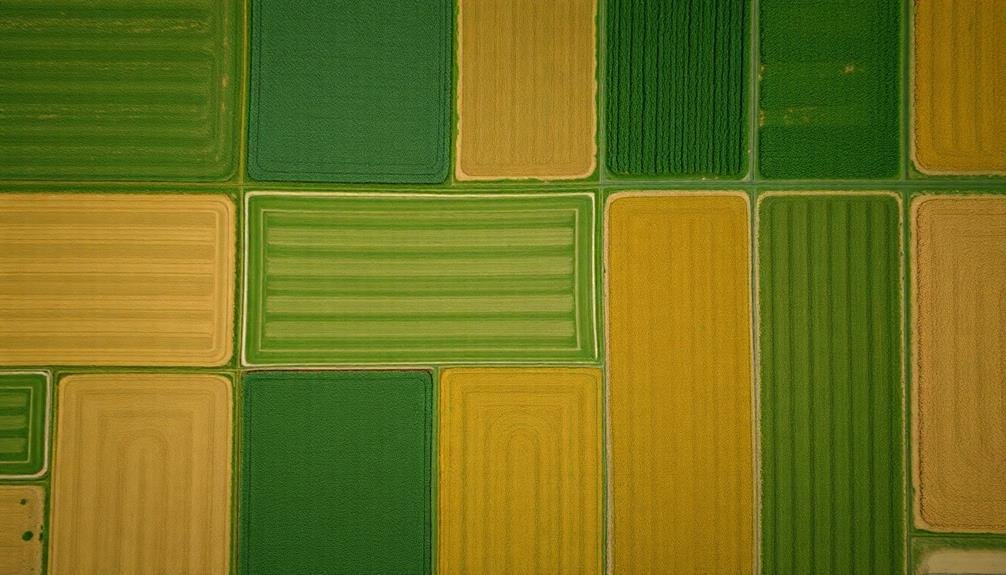
Recognizing Healthy Crop Patterns
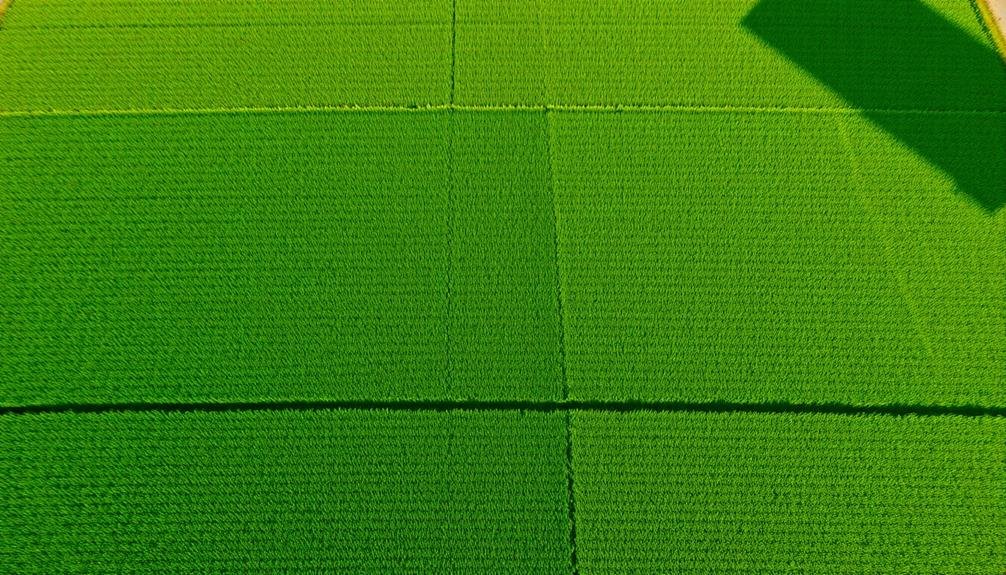
Recognizing healthy crop patterns is the foundation for effective disease detection. When you're surveying fields from above, you'll want to look for uniformity in color, height, and density. Healthy crops typically display consistent patterns across the field, with minimal variations.
You should familiarize yourself with the normal growth stages of the crops you're monitoring. This knowledge will help you identify any deviations that might indicate disease. Pay attention to the following characteristics:
| Crop Trait | Healthy Appearance | Potential Disease Indicator |
|---|---|---|
| Color | Uniform green | Yellowing or discoloration |
| Density | Even distribution | Patchy or sparse areas |
| Height | Consistent | Stunted or irregular growth |
| Leaf shape | Normal for species | Wilting or deformation |
| Canopy | Full and even | Gaps or thinning |
As you gain experience, you'll become more adept at spotting subtle differences between healthy and diseased crops. Remember that some variations are normal due to soil conditions or topography. It's essential to distinguish between these natural variations and potential disease symptoms. By establishing a baseline for healthy crop patterns, you'll be better equipped to identify and address issues early on.
Common Crop Disease Signatures
When identifying crop diseases, you'll need to look for key visual cues.
Pay attention to unusual discoloration patterns on leaves, stems, or fruits, as these often signal specific pathogens.
Watch for growth abnormalities like stunted plants or misshapen produce, and examine leaves closely for damage indicators such as spots, lesions, or unusual textures.
Discoloration Patterns
Throughout the growing season, discoloration patterns on crops serve as telltale signs of disease. As you survey your fields from above, you'll notice various color changes that can indicate specific issues. Yellowing, browning, or reddening of leaves often point to nutrient deficiencies or fungal infections. Mosaic patterns, characterized by alternating light and dark green patches, typically suggest viral diseases.
When identifying discoloration patterns, pay attention to:
- Distribution: Uniform discoloration across the field may indicate environmental stress, while patchy discoloration often signals disease.
- Progression: Observe how the discoloration spreads over time, as this can help determine the cause and severity of the issue.
- Leaf specificity: Some diseases affect only certain parts of the plant, such as older leaves or new growth.
To accurately assess discoloration patterns, use high-resolution imagery and compare it to healthy crop sections.
Remember that some discoloration may be due to natural plant aging or environmental factors. If you're unsure, consult with a plant pathologist or agronomist for a precise diagnosis.
Early detection of these patterns can help you implement timely interventions and minimize crop losses.
Growth Abnormalities
Growth abnormalities in crops can be telltale signs of underlying diseases. When observing fields from above, you'll want to look for unusual patterns or deviations from normal plant growth. Stunted growth is a common indicator, where affected plants appear shorter or less developed than their healthy counterparts.
You might notice patches of crops that aren't reaching the expected height or fullness.
Another growth abnormality to watch for is excessive branching or tillering. Some diseases cause plants to produce more branches or tillers than usual, resulting in a bushy appearance. Conversely, you might spot areas where plants have fewer branches or appear sparse compared to the surrounding crops.
Leaf deformities are also vital to identify. Look for curling, twisting, or cupping of leaves, which can indicate viral infections or nutrient deficiencies. In some cases, you'll observe entire sections of a field with malformed or misshapen plants.
Pay attention to changes in crop canopy density. Diseased plants often have thinner canopies, creating noticeable gaps or irregularities in the field's overall appearance.
Leaf Damage Indicators
Leaf damage indicators offer distinct clues for identifying crop diseases. When observing fields from above, you'll notice various patterns and discolorations that can signal potential issues. Look for irregular spots, streaks, or patches that stand out from the surrounding healthy foliage. These abnormalities often indicate the presence of fungal, bacterial, or viral infections.
Pay close attention to:
- Chlorosis: Yellowing of leaves due to lack of chlorophyll
- Necrosis: Brown or black dead tissue on leaves
- Mosaic patterns: Mottled appearance with light and dark green areas
As you scan the field, note the distribution of these symptoms. Diseases may spread in circular patterns, along rows, or in scattered clusters. The extent and speed of spread can help you determine the severity of the infection and the best course of action.
Remember that environmental factors like drought or nutrient deficiencies can also cause leaf damage. To differentiate between disease and other stressors, consider the overall field conditions and consult with local agricultural experts.
Early detection of leaf damage indicators allows for prompt intervention, potentially saving crops and minimizing yield losses.
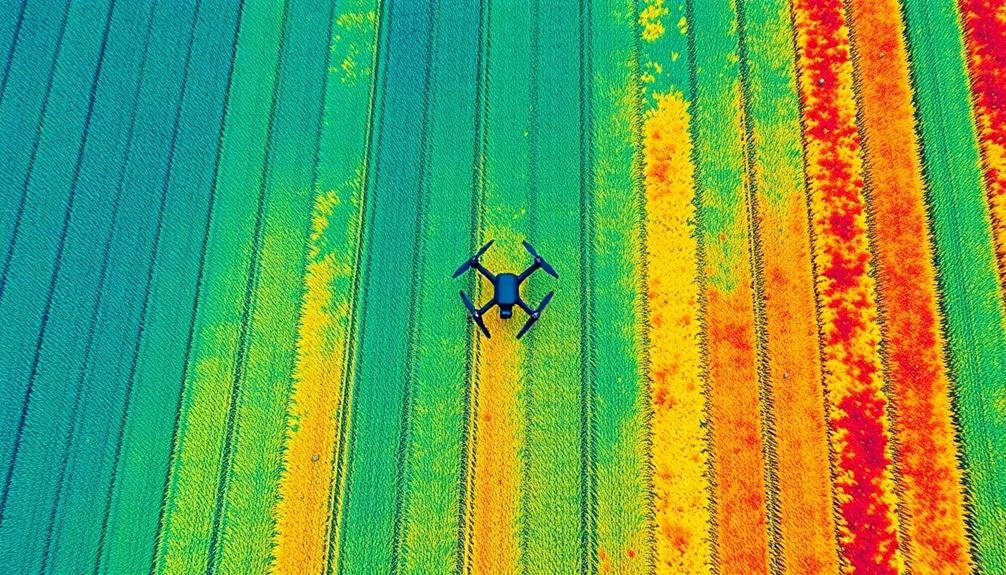
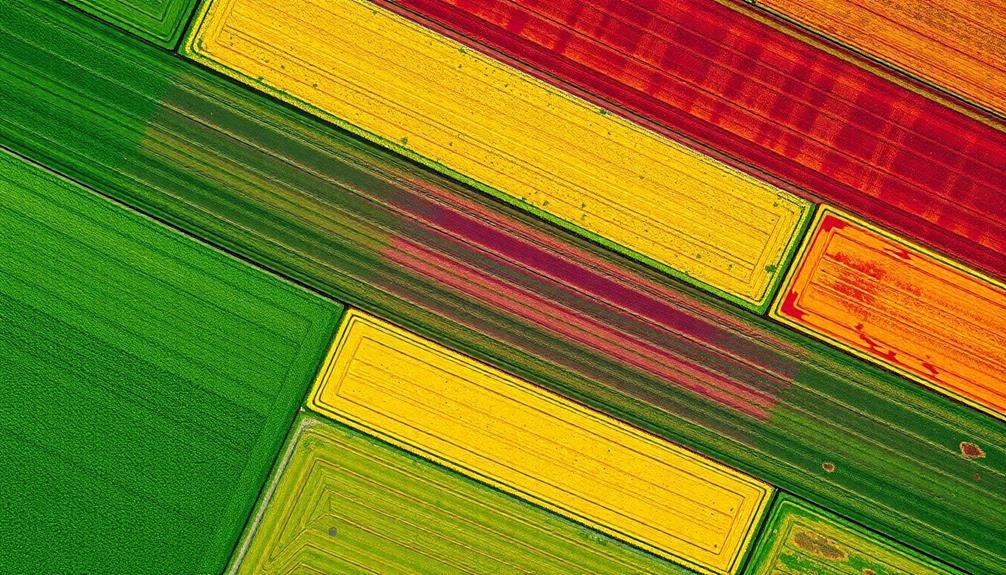
Color Analysis in Aerial Imagery
In aerial imagery, color analysis plays an essential role in identifying crop diseases. You'll need to focus on subtle color variations that can indicate plant stress or infection. Healthy crops typically appear in shades of green, while diseased areas may show yellowing, browning, or unusual discoloration.
To effectively analyze colors, use specialized software that can process multispectral or hyperspectral imagery. These tools allow you to examine specific wavelengths of light reflected by the crops, revealing information invisible to the naked eye. Pay attention to the near-infrared (NIR) spectrum, which is particularly useful for evaluating plant health.
Look for patterns in the color distribution across your fields. Diseased areas often appear as patches or clusters of abnormal coloration. Compare images over time to detect changes in crop health and disease progression. You can also use vegetation indices like NDVI (Normalized Difference Vegetation Index) to quantify plant vigor and stress levels.
Remember that different crop diseases may produce distinct color signatures. Familiarize yourself with the specific color changes associated with common diseases in your region to improve your diagnostic accuracy.
Thermal Imaging for Disease Detection
Thermal imaging can reveal temperature anomalies in crops that aren't visible to the naked eye.
You'll find that diseased plants often exhibit different heat patterns compared to healthy ones, allowing for early detection.
Temperature Anomaly Detection
Many advanced disease detection methods now employ thermal imaging to spot temperature anomalies in crops. When plants are infected, their temperature often deviates from that of healthy plants. You can use thermal cameras mounted on drones or satellites to capture these temperature variations across large fields.
To detect temperature anomalies effectively, you'll need to:
- Establish a baseline temperature for healthy crops
- Compare thermal images to this baseline
- Identify areas with significant temperature differences
Once you've captured thermal images, analyze them using specialized software. This software can highlight areas where temperatures differ from the norm, potentially indicating disease.
You'll want to pay attention to patterns in these anomalies, as different diseases can cause distinct temperature profiles.
Remember that environmental factors like sunlight, shade, and soil moisture can affect plant temperatures. It's vital to account for these variables when interpreting thermal data.
Disease-Specific Heat Patterns
Disease-specific heat signatures can provide valuable clues for identifying crop infections. When plants are under stress from diseases, their temperature patterns often change in distinct ways. You'll need to familiarize yourself with these patterns to effectively spot crop diseases using thermal imaging.
Different diseases affect plants' heat signatures differently. For example, fungal infections might cause localized hot spots, while bacterial diseases could lead to overall temperature increases. Viral infections may result in irregular heat patterns across the plant. Here's a quick reference table for common crop diseases and their thermal signatures:
| Disease Type | Heat Pattern | Detection Tips |
|---|---|---|
| Fungal | Localized hot spots | Look for circular warm areas |
| Bacterial | Overall temperature increase | Compare to healthy plants nearby |
| Viral | Irregular patterns | Check for mosaic-like heat distributions |
To use this information effectively, you'll need to calibrate your thermal imaging equipment and establish baseline temperatures for healthy crops. Regular monitoring and comparison with known disease patterns will help you identify potential outbreaks early. Remember, environmental factors can also affect plant temperatures, so consider weather conditions and time of day when interpreting thermal data.
Multispectral Sensors in Agriculture
Precision in agriculture has taken a leap forward with the advent of multispectral sensors. These advanced devices capture data across multiple bands of the electromagnetic spectrum, allowing you to detect subtle changes in crop health that aren't visible to the naked eye.
By analyzing the reflected light from plants, you'll gain valuable insights into their condition, including early signs of disease, nutrient deficiencies, and water stress.
When using multispectral sensors for crop disease detection, you'll typically focus on:
- Near-infrared (NIR) light, which healthy plants strongly reflect
- Red light absorption, indicating chlorophyll content
- Red-edge band, sensitive to early stress indicators
You can mount these sensors on drones or satellites, enabling you to survey large areas quickly and efficiently. The data collected is then processed to create detailed maps and indices, such as the Normalized Difference Vegetation Index (NDVI).
These tools help you pinpoint problem areas in your fields, allowing for targeted interventions and reducing the need for blanket treatments. By incorporating multispectral sensing into your farming practices, you'll improve crop health monitoring, optimize resource use, and ultimately increase your yields.
Data Processing and Analysis Tools
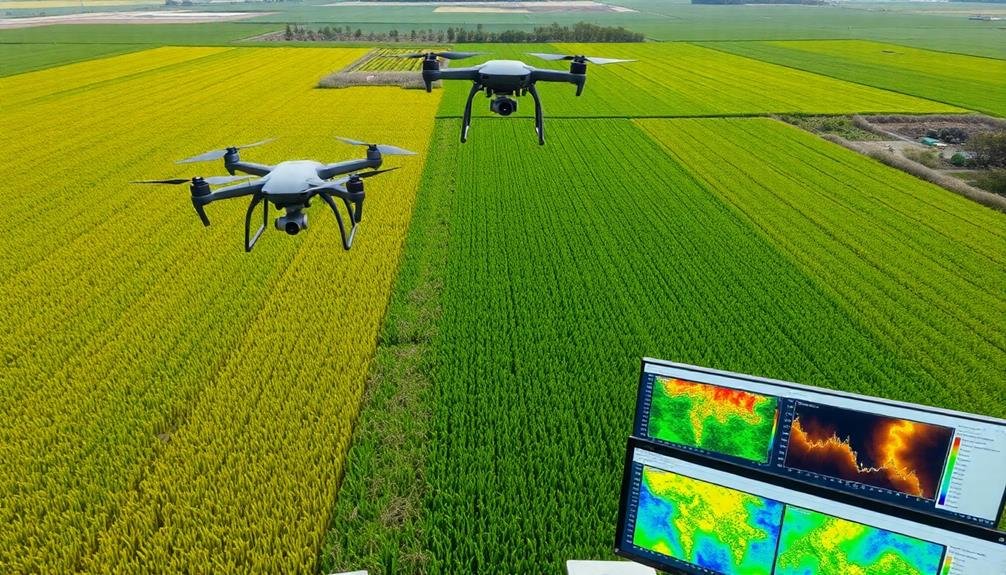
In light of the vast amounts of data collected by multispectral sensors, you'll need robust processing and analysis tools to make sense of it all. These tools typically include specialized software packages designed for agricultural applications. They can help you process raw spectral data, create vegetation indices, and generate detailed maps of your fields.
Popular software options like ENVI, ArcGIS, and QGIS offer powerful features for analyzing multispectral imagery. They allow you to perform tasks such as atmospheric correction, image classification, and change detection. You'll find tools for creating normalized difference vegetation index (NDVI) maps, which can highlight areas of stress or disease in your crops.
Machine learning algorithms are increasingly being integrated into these tools, enabling more advanced analysis. They can help you identify patterns and anomalies that might indicate the presence of crop diseases.
Cloud-based platforms like Google Earth Engine provide access to vast datasets and computing power, allowing you to process and analyze large amounts of data quickly.
To effectively use these tools, you'll need some training in remote sensing and GIS techniques. Many software providers offer online tutorials and courses to help you get started.
Interpreting Vegetation Index Maps
Vegetation index maps are powerful tools for spotting crop diseases, but they require careful interpretation. When you're looking at these maps, pay attention to color variations. Healthy vegetation typically appears in shades of green, while stressed or diseased areas often show up as yellow, orange, or red.
Remember that different indices highlight various aspects of plant health, so it's important to understand which index you're using.
To effectively interpret vegetation index maps:
- Compare current maps with historical data to identify anomalies
- Look for patterns or clusters of stressed vegetation
- Consider environmental factors that might influence the results
Don't rely solely on the maps; use them as a guide for further investigation. Ground-truthing is essential to confirm your observations.
When you spot areas of concern, physically inspect the crops to determine the cause of stress. Keep in mind that not all stress indicates disease; factors like drought, nutrient deficiencies, or pest infestations can also affect vegetation health.
Integrating Ground Truthing Techniques
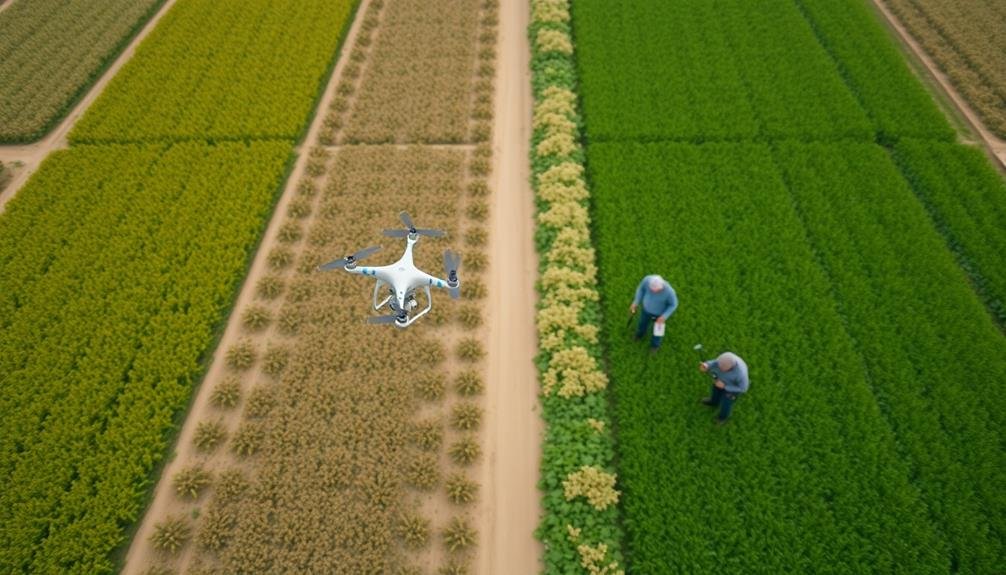
Ground truthing serves as the vital link between remote sensing data and real-world conditions. To effectively integrate ground truthing techniques, you'll need to systematically collect field data that corresponds to your remote sensing observations.
Start by identifying representative sampling points across your fields, guaranteeing they cover various crop conditions and potential disease hotspots. When visiting these points, record detailed observations, including plant health, disease symptoms, and environmental factors.
Use standardized rating scales to assess disease severity and take high-quality photographs for future reference. It's essential to geotag your observations using GPS coordinates to align them precisely with your remote sensing data.
Timing is critical in ground truthing. Conduct field visits close to when remote sensing data is collected to confirm accuracy. You should also consider seasonal variations and crop growth stages when planning your ground truthing schedule.
To improve efficiency, use mobile apps or digital forms for data collection. These tools can streamline the process and reduce errors in data entry.
Remember to calibrate your remote sensing tools based on ground truth data regularly, adjusting algorithms and thresholds as needed to enhance the accuracy of your crop disease detection efforts.
Reporting and Action Planning
Your crop disease detection efforts culminate in effective reporting and action planning. Once you've identified potential crop diseases through aerial imaging and ground truthing, it's essential to communicate your findings and develop a strategic response.
Create thorough reports that detail the location, extent, and severity of detected diseases. Include high-resolution images, maps, and data analysis to support your conclusions.
Develop a clear action plan based on your findings. This plan should outline specific steps for addressing the identified crop diseases, including:
- Targeted treatment methods and schedules
- Resource allocation for affected areas
- Preventive measures for unaffected crops
Prioritize your actions based on the severity and potential spread of each disease. Consider factors such as crop value, disease progression rates, and available resources when determining your response strategy.
Coordinate with agricultural experts, pest control specialists, and farm management to guarantee a well-rounded approach.
Implement a monitoring system to track the effectiveness of your interventions. Regularly update your reports and action plans as new information becomes available or conditions change.
Frequently Asked Questions
How Much Does It Cost to Implement Aerial Crop Disease Detection?
You'll find costs vary widely for aerial crop disease detection. They depend on factors like equipment choice, area covered, and frequency of surveys. Drones can be cheaper, while manned aircraft or satellite imagery may cost more.
Can Aerial Surveys Detect Pest Infestations in Addition to Diseases?
Yes, you can detect pest infestations using aerial surveys. They'll help you spot changes in crop color, texture, and growth patterns that indicate pest presence. You'll need high-resolution imagery and specialized sensors for the best results.
Are There Legal Restrictions on Using Drones for Agricultural Monitoring?
You'll find legal restrictions on using drones for agricultural monitoring vary by country. In the US, you'll need to follow FAA regulations, obtain proper licenses, and respect privacy laws when flying over private property.
How Often Should Aerial Surveys Be Conducted for Optimal Disease Detection?
You'll want to conduct aerial surveys every 1-2 weeks during the growing season for ideal disease detection. However, you should increase frequency if you're noticing signs of disease or during high-risk periods for specific crop pathogens.
Can Aerial Crop Disease Detection Work for Indoor or Greenhouse Farming?
You can use aerial detection for indoor or greenhouse farming, but it's less common. You'll need specialized equipment like drones with thermal cameras. It's often more practical to use ground-based monitoring for these controlled environments.
In Summary
You've now got the tools to spot crop diseases from the sky. By using the right drone equipment, following ideal flight patterns, and mastering data analysis, you'll catch problems early. Remember to integrate ground truthing and interpret vegetation index maps carefully. With practice, you'll become adept at recognizing healthy crop patterns and spotting anomalies. Don't forget to create actionable reports. Your aerial surveys will revolutionize how you manage crop health.
As educators and advocates for responsible drone use, we’re committed to sharing our knowledge and expertise with aspiring aerial photographers.

Leave a Reply