
Wetland imagery can reveal essential information about plant health through various remote sensing techniques. You'll discover insights into vegetation density, stress levels, and the presence of invasive species. Multispectral and hyperspectral imaging allow you to assess chlorophyll content and photosynthetic activity using vegetation indices like NDVI. These tools help detect environmental stressors, such as drought or pollution, before visible symptoms appear. You can track temporal changes in plant health, identify early signs of disease, and monitor the spread of non-native species. By integrating drone technology, you'll gain even more detailed data on wetland ecosystem dynamics. Exploring these imaging techniques further will uncover a wealth of knowledge about wetland plant health.
Remote Sensing Techniques
How do scientists observe vast wetland ecosystems without disturbing them? They turn to remote sensing techniques, which allow for non-invasive monitoring of wetland environments. These methods utilize various technologies to collect data from a distance, typically using satellites or aircraft.
You'll find that multispectral and hyperspectral imaging are key tools in this field. They capture light reflectance across different wavelengths, revealing information about plant health, water quality, and soil conditions.
LiDAR (Light Detection and Ranging) is another important technique, using laser pulses to create detailed 3D maps of wetland topography and vegetation structure.
Synthetic Aperture Radar (SAR) can penetrate cloud cover and vegetation, making it indispensable for monitoring wetland hydrology and detecting changes in water levels. Thermal imaging helps identify temperature variations, which can indicate plant stress or water circulation patterns.
These remote sensing techniques are often combined with ground-based measurements and historical data to create thorough assessments of wetland health.
Vegetation Indices and Spectral Analysis
Building on remote sensing techniques, vegetation indices and spectral analysis provide powerful tools for evaluating wetland plant health. These methods utilize the unique spectral signatures of plants to assess their condition and liveliness.
You'll find that vegetation indices, such as the Normalized Difference Vegetation Index (NDVI), are particularly useful. They combine data from different spectral bands to highlight specific plant characteristics. NDVI, for instance, uses red and near-infrared reflectance to measure chlorophyll content and photosynthetic activity.
When you're analyzing wetland imagery, you can apply various indices to detect stress, disease, or changes in plant communities. The Enhanced Vegetation Index (EVI) can help you overcome some limitations of NDVI in areas with dense vegetation. For more specific analyses, you might use indices like the Normalized Difference Water Index (NDWI) to assess plant water content.
Spectral analysis goes beyond simple indices, allowing you to examine the full reflectance spectrum of wetland vegetation. You can identify subtle changes in plant pigments, cellular structure, and biochemical composition.
This detailed information helps you detect early signs of environmental stress or invasive species encroachment, enabling more effective wetland management and conservation strategies.
Stress Detection in Wetland Plants
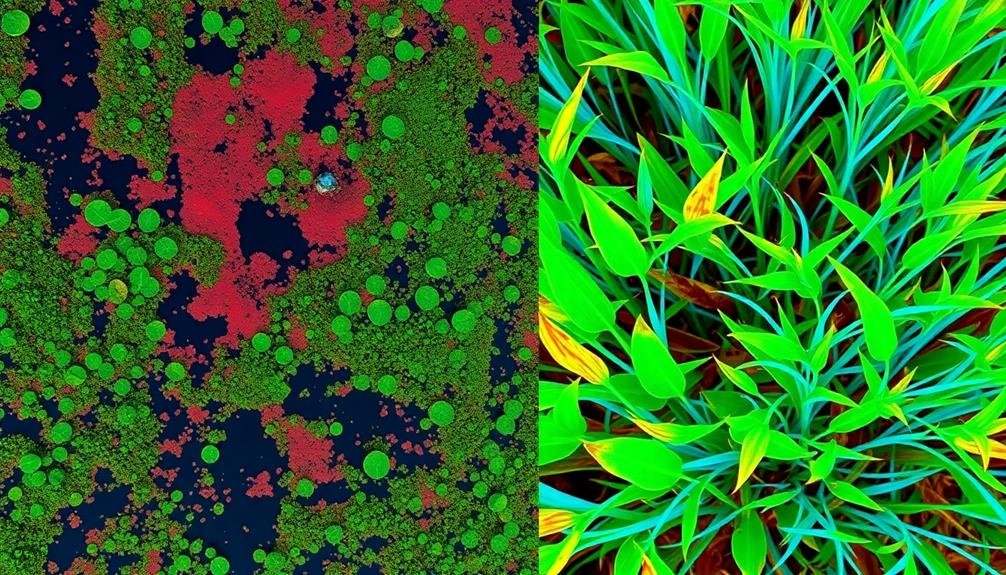
In recent years, detecting stress in wetland plants has become increasingly essential for ecosystem management.
You'll find that remote sensing techniques have revolutionized our ability to monitor plant health across vast wetland areas. By analyzing spectral signatures and vegetation indices, you can identify signs of stress before they're visible to the naked eye.
Stress detection in wetland plants allows you to:
- Identify early warning signs of ecosystem disturbance
- Monitor the impact of climate change on wetland vegetation
- Assess the effectiveness of conservation efforts
- Detect invasive species and their effects on native plants
You'll need to evaluate various stressors that affect wetland plants, including drought, flooding, salinity, and pollution.
Hyperspectral imagery can reveal subtle changes in plant pigmentation and structure, indicating stress responses. You can also use thermal imaging to detect water stress by measuring leaf surface temperatures.
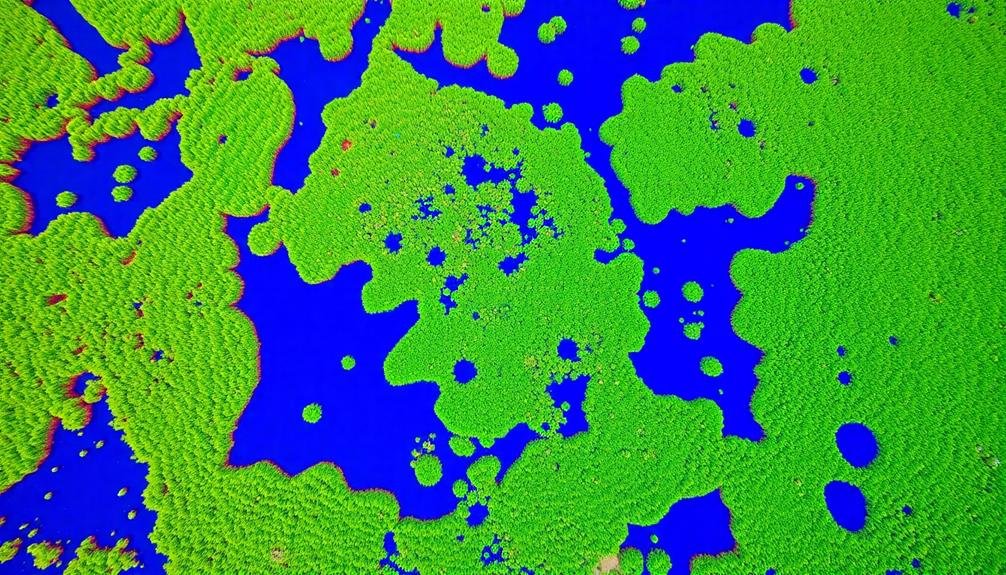
Invasive Species Identification
You'll find that invasive species identification in wetlands often relies on spectral signature detection, allowing you to distinguish non-native plants from indigenous vegetation.
By analyzing vegetation density, you can spot unusual growth patterns that may indicate the presence of invasive species.
You can also employ temporal change monitoring to track the spread of these unwanted plants over time, enabling early intervention and more effective management strategies.
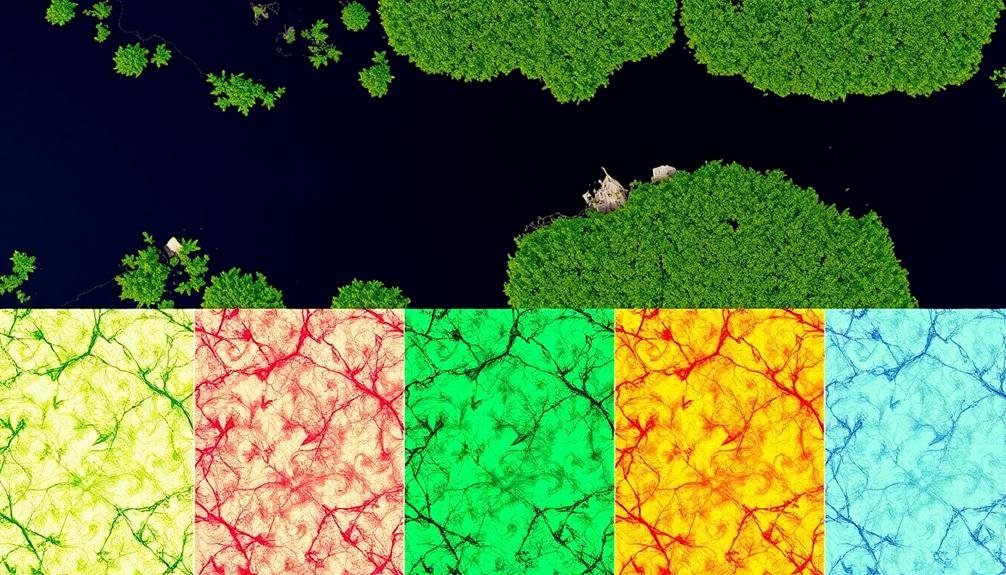
Spectral Signature Detection
Spectral signature detection plays an essential role in identifying invasive species within wetland ecosystems. This technology allows you to analyze the unique reflectance patterns of different plant species across various wavelengths of light. By capturing these spectral signatures using remote sensing techniques, you can quickly identify and map the presence of invasive plants in wetland areas.
To effectively use spectral signature detection for invasive species identification, you'll need to:
- Collect reference spectral data for known invasive and native plant species
- Use high-resolution multispectral or hyperspectral sensors for image capture
- Apply advanced image processing algorithms to extract spectral information
- Develop a spectral library to compare and classify plant species
You can leverage this technology to monitor large wetland areas efficiently, detecting early signs of invasive species spread. By analyzing changes in spectral signatures over time, you'll be able to track the progression of invasions and assess the effectiveness of management strategies.
This approach also helps in identifying stressed or unhealthy native plants, which may be more susceptible to invasion. With spectral signature detection, you'll have a powerful tool to protect wetland biodiversity and maintain ecosystem health.
Vegetation Density Analysis
While spectral signature detection focuses on individual plant characteristics, vegetation density analysis provides a broader perspective on invasive species identification.
You'll find this method particularly useful when evaluating the spread and impact of non-native plants in wetland ecosystems.
By analyzing vegetation density, you can identify areas where invasive species are outcompeting native plants. This technique involves measuring the amount of vegetation cover within a given area using remote sensing data.
You'll often use normalized difference vegetation index (NDVI) or other vegetation indices to quantify plant density.
When you're examining wetland imagery, look for patterns of unusually dense vegetation or rapid changes in density over time. These can be indicators of invasive species proliferation.
You'll want to compare the density patterns with known characteristics of invasive plants in your region.
Combining vegetation density analysis with spectral signature detection enhances your ability to pinpoint invasive species.
You can use this information to create maps showing the distribution and spread of non-native plants, helping you develop targeted management strategies for wetland conservation efforts.
Temporal Change Monitoring
Over time, invasive species can dramatically alter wetland ecosystems. You can use temporal change monitoring to identify and track these invaders, helping preserve native biodiversity.
By analyzing satellite imagery and aerial photographs taken at regular intervals, you'll detect changes in vegetation patterns that might indicate the spread of non-native plants.
This method allows you to:
- Spot early signs of invasion before they become widespread
- Track the rate and direction of invasive species spread
- Assess the effectiveness of eradication efforts
- Identify areas at high risk for future invasions
You'll need to establish a baseline of normal seasonal changes in your wetland's vegetation to distinguish between natural fluctuations and invasive growth.
Look for sudden increases in plant density, changes in texture or color, and the appearance of new growth patterns.
Combine this visual analysis with on-the-ground surveys to confirm your findings and identify specific species.
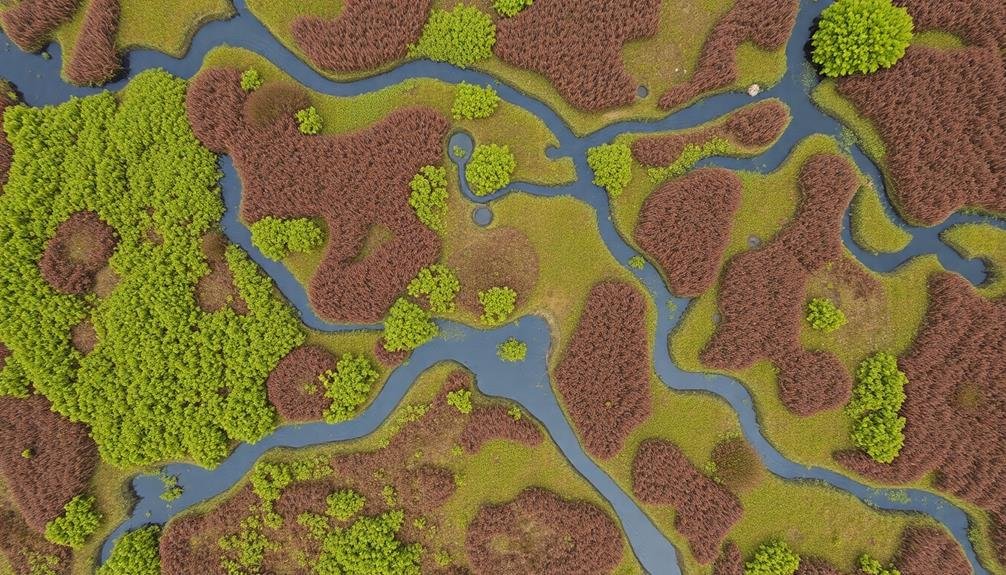
Temporal Changes in Plant Health
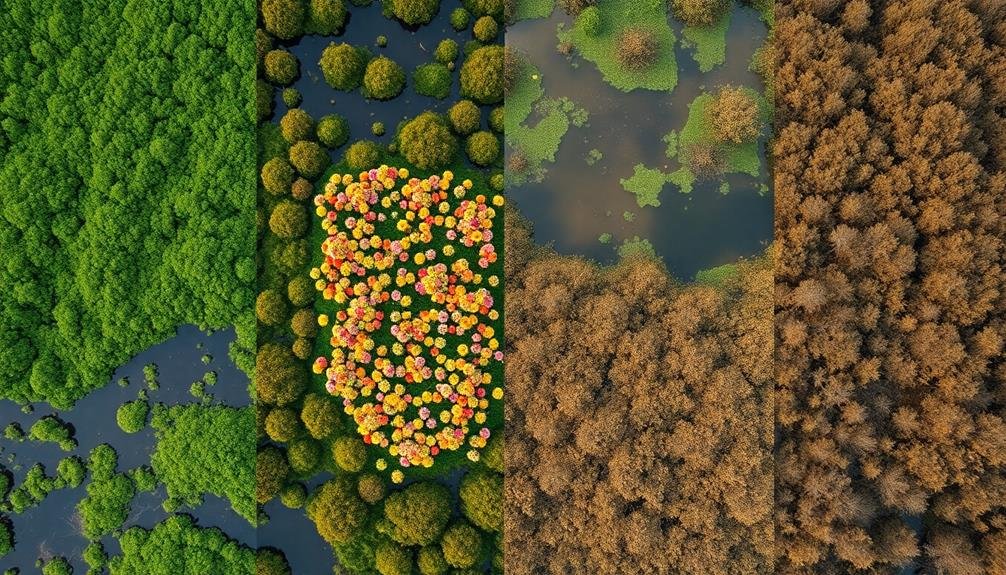
Wetlands' plant health undergoes significant changes over time, influenced by various environmental factors. You'll notice these shifts through careful analysis of temporal imagery. By comparing satellite or aerial photos taken at different intervals, you can track variations in vegetation density, color, and distribution.
Look for changes in the Normalized Difference Vegetation Index (NDVI) values, which indicate photosynthetic activity and overall plant vigor. Higher NDVI values suggest healthier vegetation, while decreases may signal stress or decline.
You'll also want to observe alterations in species composition, as some plants may thrive while others struggle due to changing conditions. Pay attention to seasonal patterns, as wetland plants often exhibit cyclical growth and senescence.
However, unexpected deviations from these patterns could indicate environmental stressors like pollution, invasive species, or climate change impacts. You can use multispectral imagery to detect subtle changes in plant pigmentation, which may reveal early signs of disease or nutrient deficiencies.
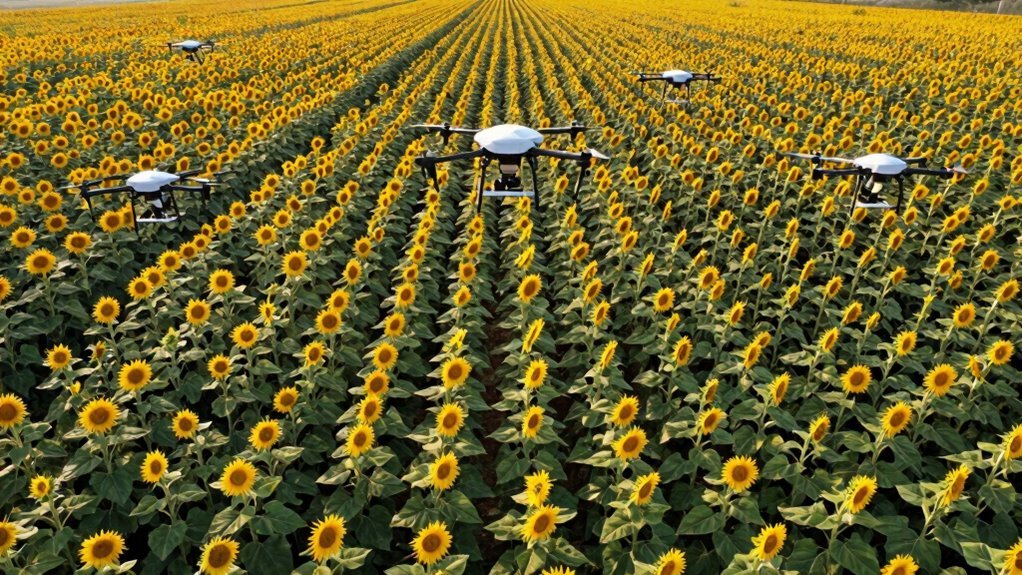
Drone Data Integration and Interpretation
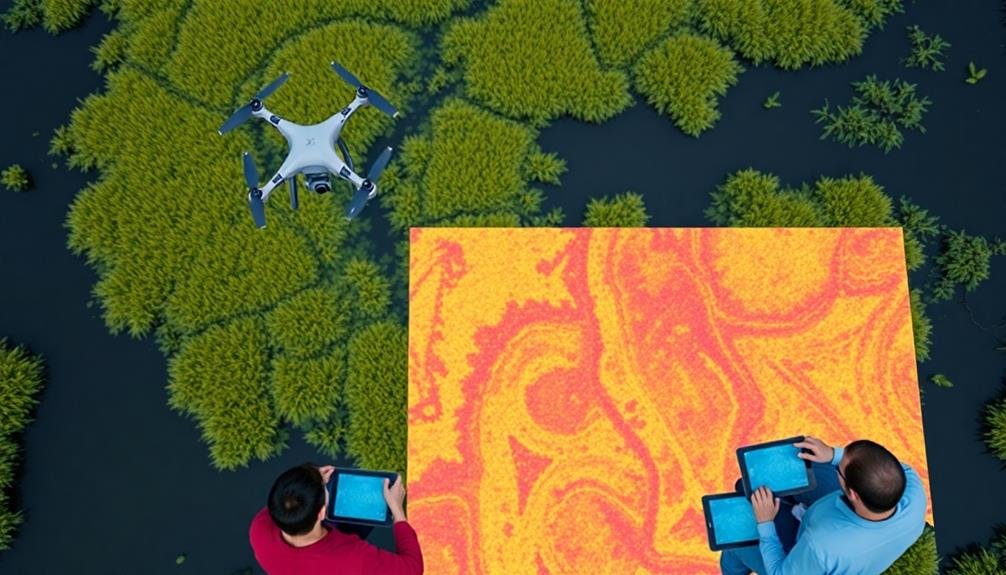
Drone technology has revolutionized wetland monitoring, offering unprecedented detail and flexibility in data collection. You'll find that integrating drone data into your wetland plant health assessments can provide a wealth of information. When interpreting this data, you're able to detect subtle changes in vegetation patterns, identify stress indicators, and map invasive species spread with remarkable accuracy.
To effectively integrate and interpret drone data for wetland plant health analysis, consider these key points:
- Combine multispectral imagery with high-resolution RGB photos for thorough assessments
- Use machine learning algorithms to automate plant species identification and health classification
- Implement time-series analysis to track changes in vegetation indices over multiple seasons
- Integrate ground-truth data to validate and calibrate drone-based measurements
You'll need to develop a standardized workflow for processing and analyzing drone imagery. This includes georeferencing, mosaicking, and applying appropriate vegetation indices.
Frequently Asked Questions
How Do Wetland Plants Adapt to Changing Water Levels?
You'll find wetland plants adapt to changing water levels through various strategies. They develop flexible stems, air-filled tissues, and extensive root systems. Some can elongate rapidly, while others produce floating leaves or switch between aquatic and terrestrial forms.
What Role Do Wetland Plants Play in Carbon Sequestration?
You'll find wetland plants are carbon-capturing champions. They'll absorb CO2 through photosynthesis and store it in their biomass and soil. These plants can sequester carbon for long periods, making wetlands vital carbon sinks in our fight against climate change.
Can Wetland Imagery Detect Pollutants Affecting Plant Health?
You can use wetland imagery to detect pollutants affecting plant health. It'll show discoloration, stress patterns, and changes in vegetation density. You'll spot signs of contamination through spectral analysis and visual interpretation of aerial or satellite images.
How Do Seasonal Variations Impact Wetland Plant Imagery Analysis?
You'll notice seasonal variations profoundly impact wetland plant imagery analysis. As plants change throughout the year, you're likely to see differences in color, density, and spectral signatures. You'll need to account for these when interpreting data.
What Are the Challenges in Distinguishing Between Similar Wetland Plant Species?
You'll face challenges distinguishing similar wetland plant species due to their overlapping visual characteristics. You'll need high-resolution imagery, advanced spectral analysis, and expert knowledge to differentiate subtle differences in leaf structure, color, and growth patterns.
In Summary
You've seen how wetland imagery can reveal essential insights about plant health. By leveraging remote sensing, spectral analysis, and drone technology, you're able to detect stress, identify invasives, and track changes over time. These tools empower you to make informed decisions about wetland management and conservation. As you continue to explore and refine these techniques, you'll gain an ever-clearer picture of your wetland ecosystems' health and resilience.
As educators and advocates for responsible drone use, we’re committed to sharing our knowledge and expertise with aspiring aerial photographers.


Leave a Reply