Urban zoning choices are best informed by a diverse array of imaging techniques. You'll find aerial photography provides a thorough overview, while high-resolution satellite imagery offers detailed insights. LiDAR and 3D modeling help visualize potential zoning impacts, and thermal imaging identifies urban heat islands. Multispectral analysis reveals land use patterns, and drone surveys assess density. Time-lapse imagery tracks growth trends, while environmental analysis through aerial imagery evaluates ecosystem health. Traffic flow visualization aids infrastructure planning, and green space mapping guarantees balanced urban development. Each technique contributes unique data, painting a fuller picture for informed decision-making.
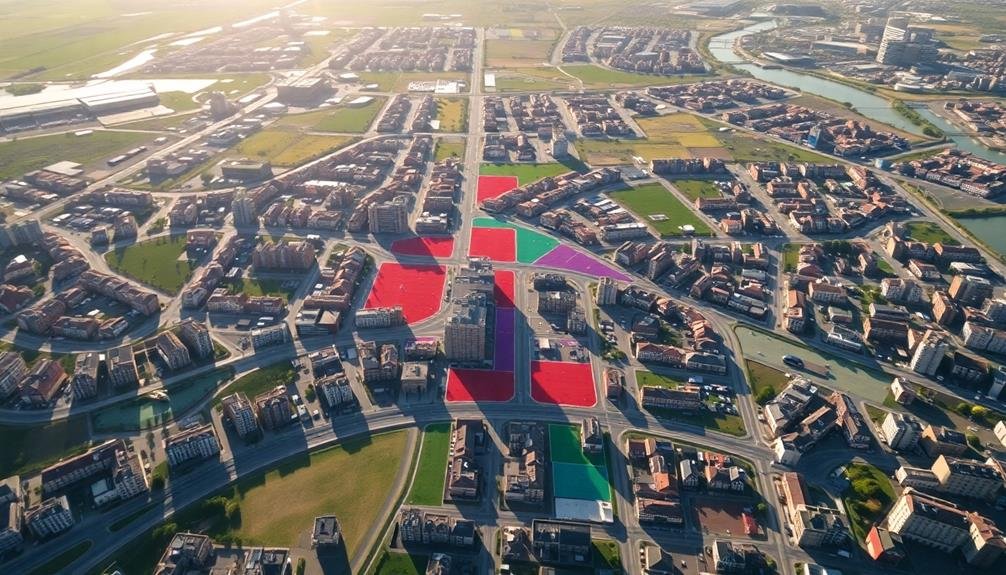
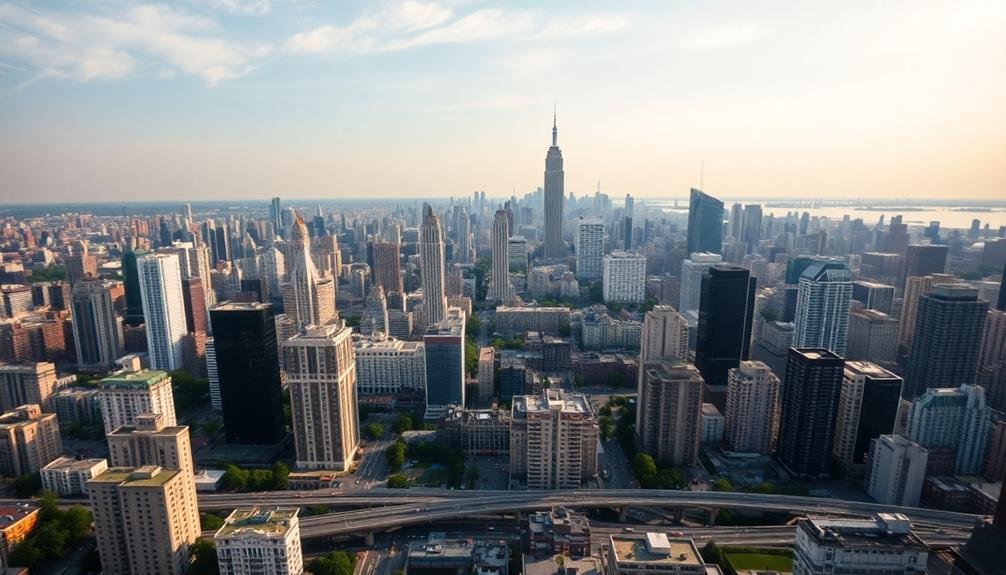
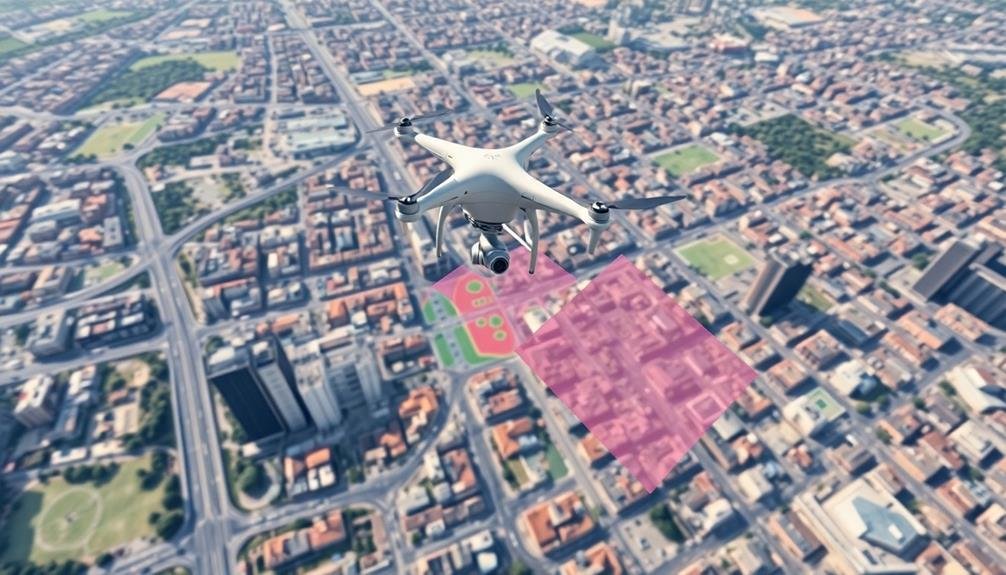
Aerial Perspective for Urban Planning
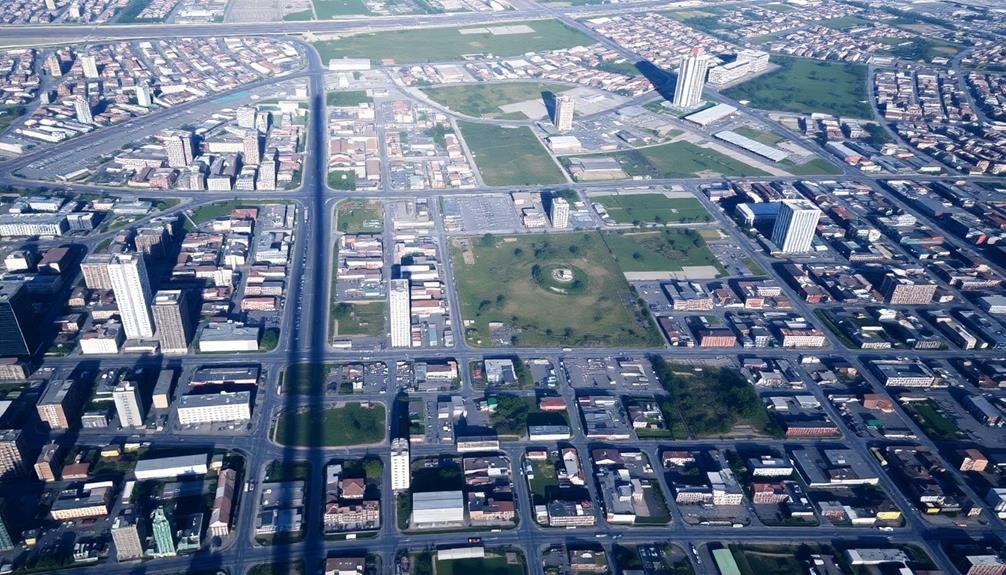
An aerial perspective provides urban planners with a powerful tool for visualizing and understanding city layouts. From above, you can see the intricate patterns of streets, buildings, and open spaces that make up the urban fabric. This bird's-eye view allows you to identify key features like commercial districts, residential areas, and industrial zones.
You'll notice how different land uses interact and where potential conflicts or opportunities for improvement exist. Aerial imagery helps you assess the distribution of green spaces, evaluate transportation networks, and spot areas of urban sprawl or density.
By examining aerial photos over time, you can track urban growth and development trends. This historical context is invaluable for making informed zoning decisions. You'll also be able to identify underutilized spaces and areas ripe for redevelopment.
When planning for future growth, aerial perspectives let you visualize how proposed changes might impact the existing urban landscape. You can use this information to create more balanced, sustainable, and livable cities.
High-Resolution Mapping Techniques

High-resolution mapping techniques have revolutionized urban planning by providing incredibly detailed and accurate representations of cities. You'll find these technologies offer unprecedented insights into urban landscapes, allowing planners to make more informed zoning decisions.
LiDAR (Light Detection and Ranging) is a key player in this field. It uses laser pulses to create 3D models of urban environments, capturing everything from building heights to tree canopies. You'll appreciate how this data helps in evaluating sunlight exposure, wind patterns, and potential flood risks.
Satellite imagery, when combined with advanced spectral analysis, allows you to identify land use patterns and monitor changes over time. This proves invaluable for tracking urban sprawl and managing green spaces.
Here's a comparison of high-resolution mapping techniques:
| Technique | Resolution | Coverage | Applications |
|---|---|---|---|
| LiDAR | cm-level | Local | 3D modeling, flood risk evaluation |
| Satellite | m-level | Global | Land use monitoring, change detection |
| Aerial Photography | cm-level | Regional | Building inspection, urban forestry |
| Drone Mapping | mm-level | Local | Construction monitoring, infrastructure inspection |
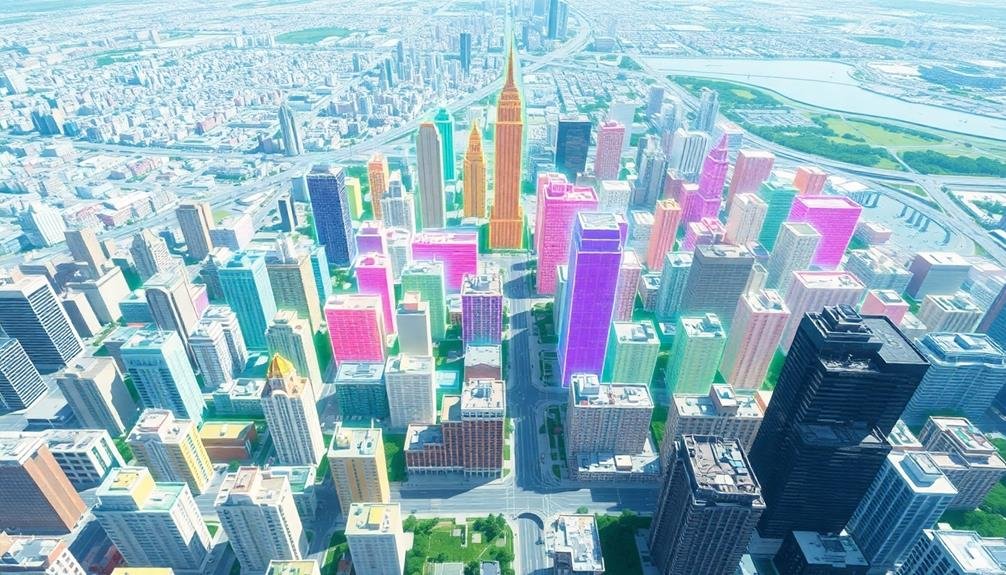
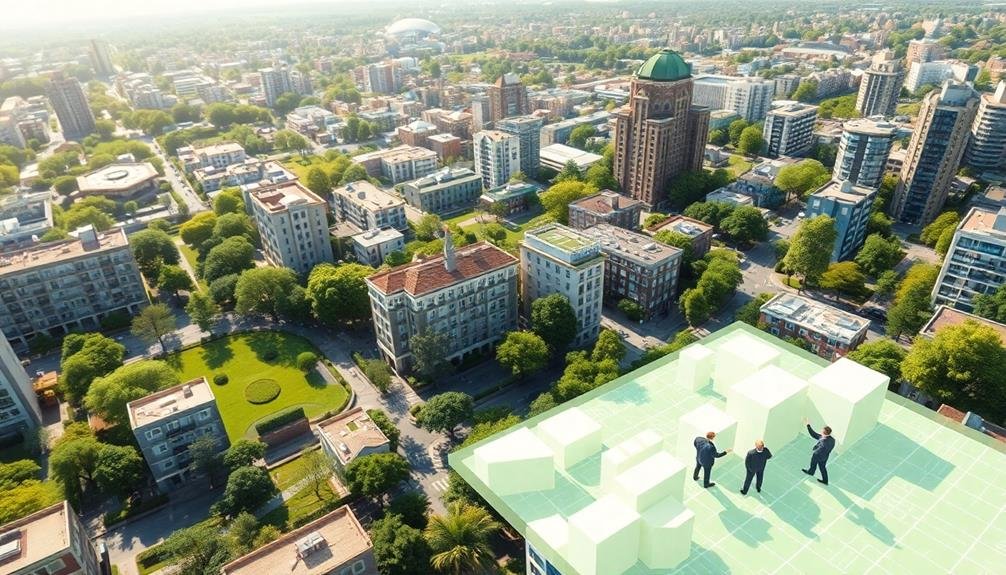
3D Modeling for Zoning Decisions
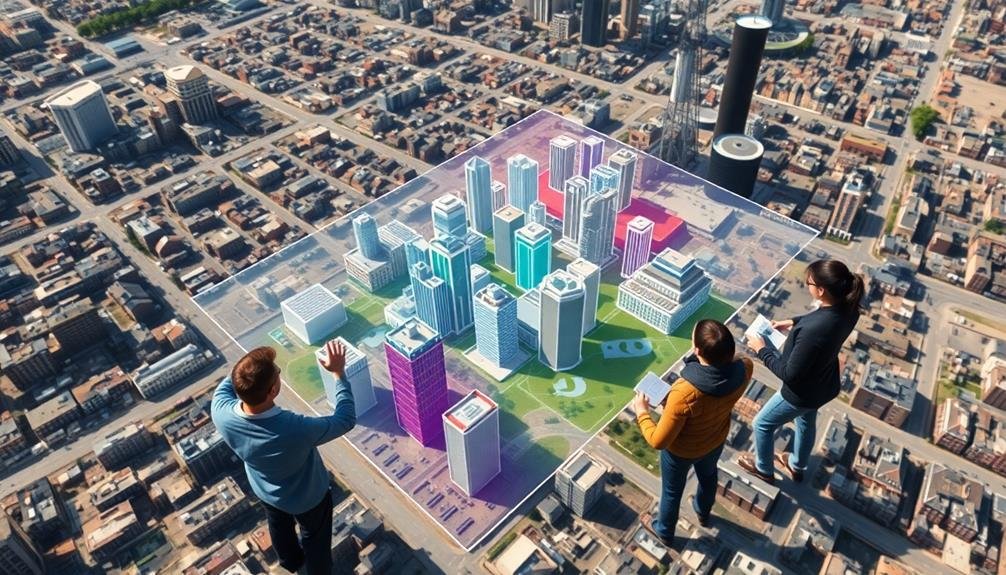
You'll find 3D modeling invaluable for making informed zoning decisions.
With these tools, you can visualize building height restrictions, simulate changes in neighborhood density, and assess the impact of shadows cast by proposed structures.
Visualizing Building Height Restrictions
Urban planners' toolkits have expanded considerably with the advent of 3D modeling for visualizing building height restrictions. You'll find these tools invaluable for illustrating proposed zoning changes and their potential impacts on cityscapes.
By creating virtual representations of urban environments, you can easily demonstrate how different height limits affect skylines, shadows, and overall urban aesthetics.
When using 3D modeling for visualizing building height restrictions, you'll want to focus on:
- Accuracy: Confirm your models precisely represent existing structures and topography.
- Flexibility: Create multiple scenarios with varying height limits to compare outcomes.
- Interactivity: Allow stakeholders to explore the models from different perspectives.
These visualizations help you communicate complex zoning concepts to both decision-makers and the public. You can clearly show how height restrictions impact views, sunlight exposure, and neighborhood character.
Simulating Neighborhood Density Changes
Beyond visualizing height restrictions, 3D modeling tools offer powerful capabilities for simulating neighborhood density changes. You can use these tools to create virtual scenarios of how zoning decisions might impact an area's population density and overall character.
Start by inputting current building footprints, heights, and land use data into the 3D model. Then, apply proposed zoning changes to see how they'd affect the neighborhood's fabric. You'll be able to visualize potential increases in housing units, commercial spaces, or mixed-use developments.
These simulations help you understand the implications of different density levels. You can see how increased density might affect traffic patterns, public transportation needs, and green space availability.
It's also possible to assess the visual impact of denser development on existing streetscapes and viewsheds.
Assessing Shadow Impact Analysis
When evaluating zoning decisions, shadow impact analysis plays an essential role in understanding how new developments might affect surrounding areas. 3D modeling tools enable you to simulate sunlight patterns throughout the day and year, helping you assess potential impacts on nearby properties, public spaces, and solar energy systems.
To conduct an effective shadow impact analysis, you'll need to:
- Create accurate 3D models of proposed buildings and surrounding structures
- Input geographical data, including latitude, longitude, and orientation
- Run simulations for different times of day and seasons
By visualizing shadow projections, you can identify potential issues like excessive shading on neighboring properties or public spaces. This information helps you make informed decisions about building heights, setbacks, and overall massing.
You'll be able to evaluate whether proposed developments comply with local zoning regulations and sunlight access requirements.
Shadow impact analysis also allows you to assess the viability of solar energy installations on nearby buildings. By understanding how new structures might affect solar exposure, you can make recommendations to preserve or enhance renewable energy potential in the area.
This proactive approach guarantees that urban development aligns with sustainability goals and maintains quality of life for residents.
Thermal Imaging in Urban Development

Harnessing the power of thermal imaging technology has revolutionized urban development practices. You'll find this tool invaluable for identifying heat islands, monitoring energy efficiency, and planning sustainable urban spaces. Thermal imaging cameras capture infrared radiation, revealing temperature variations across cityscapes.
You can use thermal imaging to:
- Detect building insulation issues
- Assess urban heat island effects
- Plan green spaces for cooling
- Optimize energy consumption
- Monitor infrastructure conditions
Here's a breakdown of thermal imaging applications in urban development:
| Application | Benefits |
|---|---|
| Heat Island Mapping | Identify hotspots for targeted cooling strategies |
| Energy Audits | Pinpoint inefficiencies in buildings and infrastructure |
| Vegetation Analysis | Assess the cooling effect of green spaces |
| Urban Planning | Inform decisions on building placement and materials |
| Infrastructure Monitoring | Detect issues in pipelines and electrical systems |
Multispectral Analysis for Land Use
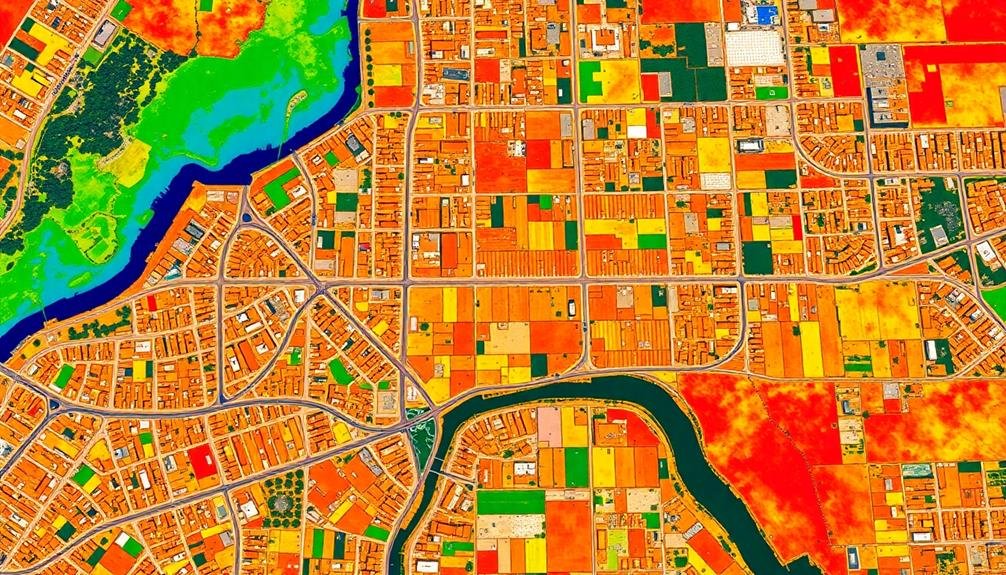
Multispectral analysis offers you powerful tools for urban land use planning.
You'll find it invaluable for evaluating vegetation density, identifying impervious surfaces, and creating urban heat maps.
These capabilities enable you to make data-driven decisions about zoning, green space allocation, and strategies to mitigate urban heat islands.
Vegetation Density Assessment
Satellite imagery has revolutionized our ability to evaluate vegetation density in urban areas. By analyzing multispectral data, you can accurately measure the distribution and health of green spaces within cities. This information is essential for urban planners and policymakers to make informed zoning decisions that balance development with environmental preservation.
When evaluating vegetation density, you'll typically use the Normalized Difference Vegetation Index (NDVI). This index leverages the unique spectral signatures of plants to quantify their presence and vigor.
Here's how you can use NDVI for urban planning:
- Identify green spaces: Map out existing parks, urban forests, and other vegetated areas.
- Monitor changes: Track the loss or gain of vegetation over time due to urban expansion or greening initiatives.
- Evaluate environmental quality: Assess the overall health of urban ecosystems and their potential impact on air quality and urban heat islands.
Impervious Surface Identification
Beyond vegetation, identifying impervious surfaces is vital for urban planning and zoning decisions. You'll find that multispectral analysis is a powerful tool for this task. It uses various wavelengths of light to distinguish between different surface types.
When you're looking at impervious surfaces, you're primarily concerned with man-made structures like roads, buildings, and parking lots. These surfaces don't allow water to penetrate, which affects drainage and urban heat island effects.
Multispectral imagery can help you differentiate these from permeable surfaces like grass, soil, or water bodies. You'll typically use near-infrared (NIR) and shortwave infrared (SWIR) bands in combination with visible light. Impervious surfaces often have higher reflectance in these bands compared to vegetation or water.
By analyzing the spectral signatures, you can create accurate maps of impervious surface coverage. This information is significant for zoning decisions. It helps you understand current land use patterns, plan for stormwater management, and assess the environmental impact of urban development.
You can also use it to monitor changes over time, tracking urban sprawl and its effects on local ecosystems.
Urban Heat Mapping
Urban heat mapping builds on the insights gained from impervious surface identification. It's an essential tool for understanding temperature variations within cities, helping you make informed zoning decisions.
By using multispectral satellite imagery or thermal sensors, you'll be able to identify and analyze urban heat islands. These heat maps reveal areas with higher surface temperatures, often correlating with dense urban development and lack of vegetation.
You'll find this information invaluable for:
- Identifying neighborhoods at risk of heat-related health issues
- Planning green spaces and tree-planting initiatives
- Developing strategies to mitigate urban heat island effects
When analyzing urban heat maps, you'll notice patterns related to land use, building materials, and vegetation cover. High-temperature zones often coincide with industrial areas, large parking lots, and densely built commercial districts.
Cooler areas typically correspond to parks, water bodies, and residential neighborhoods with mature trees.
Time-Lapse Imagery for Growth Patterns
Over the past few decades, time-lapse imagery has become an invaluable tool for understanding urban growth patterns. You can now visualize decades of urban development in mere minutes, revealing trends that might otherwise go unnoticed. This technology allows you to track changes in land use, infrastructure development, and population density over time.
By analyzing time-lapse imagery, you'll gain insights into how cities expand, where new neighborhoods emerge, and how industrial areas evolve. It's particularly useful for identifying sprawl, infill development, and gentrification trends. You can also spot potential zoning issues before they become major problems.
Here's a breakdown of what time-lapse imagery can reveal about urban growth:
| Time Frame | Observable Changes | Zoning Implications |
|---|---|---|
| 1-5 years | New construction | Short-term planning |
| 5-10 years | Neighborhood shifts | Mid-term adjustments |
| 10-20 years | Infrastructure expansion | Long-term strategy |
| 20-50 years | Urban sprawl patterns | thorough plan revisions |
| 50+ years | Historical trends | Legacy impact assessment |
LiDAR Technology in Urban Zoning
LiDAR technology has revolutionized urban mapping capabilities, offering unprecedented precision in zoning decisions.
You'll find that LiDAR's high-resolution 3D scans provide detailed information on building heights, land contours, and infrastructure placement.
This accuracy allows city planners to make more informed zoning choices, ensuring compliance with regulations and optimizing urban space utilization.
Lidar's Urban Mapping Capabilities
Revolutionizing urban planning, LiDAR technology has become an indispensable tool for creating detailed 3D maps of cities. You'll find that LiDAR's urban mapping capabilities offer unprecedented accuracy and depth, allowing you to visualize and analyze urban landscapes in ways never before possible.
LiDAR's ability to capture intricate details of buildings, infrastructure, and terrain provides you with a thorough understanding of your city's layout. You can use this data to:
- Identify potential development areas
- Evaluate the impact of proposed zoning changes
- Analyze traffic patterns and pedestrian flow
With LiDAR, you're able to create precise digital elevation models, which are vital for flood risk evaluation and stormwater management.
You'll also benefit from its ability to penetrate vegetation, revealing hidden structures and topographical features that might otherwise go unnoticed.
LiDAR's urban mapping capabilities extend to capturing data on building heights, roof types, and even facade details. This information is invaluable when you're updating zoning regulations or evaluating the visual impact of new developments.
Zoning Accuracy With Lidar
Building on LiDAR's urban mapping capabilities, its application in zoning accuracy has transformed the way cities approach land use planning. You'll find that LiDAR technology provides precise 3D measurements of buildings, infrastructure, and terrain, allowing urban planners to make more informed zoning decisions.
With LiDAR, you can accurately determine building heights, setbacks, and lot coverage, ensuring compliance with zoning regulations. This technology enables you to identify potential zoning violations and assess the impact of proposed developments on neighboring properties.
You'll appreciate how LiDAR data helps in creating detailed digital elevation models, which are essential for flood zone mapping and stormwater management planning.
LiDAR's high-resolution imagery also assists in identifying and preserving historical structures, green spaces, and environmentally sensitive areas. You can use this data to optimize land use, plan for future growth, and make data-driven decisions about zoning changes.
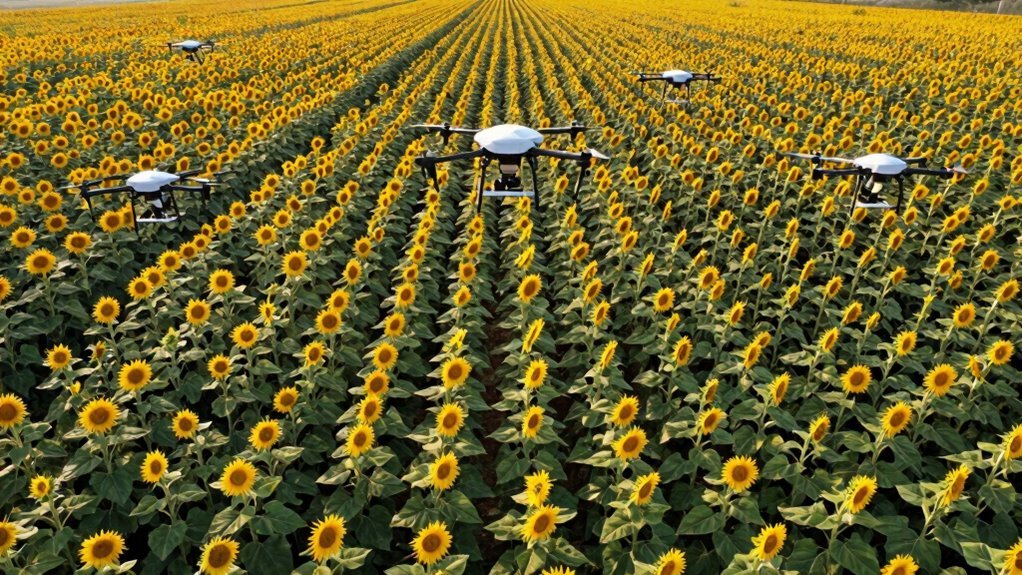
Drone Surveys for Density Assessment
Drones equipped with advanced sensors are transforming how urban planners assess population density. You'll find these aerial devices capturing high-resolution imagery and data that provide invaluable insights into urban landscapes. They're particularly useful for analyzing building heights, occupancy patterns, and open spaces – all essential factors in determining population density.
When you're using drone surveys for density assessment, you'll benefit from:
- Real-time data collection: Drones can quickly cover large areas, providing up-to-date information on urban development.
- Cost-effectiveness: Compared to traditional survey methods, drone surveys are often more affordable and require less manpower.
- Accessibility: Drones can reach areas that might be challenging or dangerous for ground-based surveyors.
You'll find that drone-captured data helps create accurate 3D models of urban environments, allowing you to visualize and analyze density patterns more effectively.
This technology enables you to make informed decisions about zoning regulations, infrastructure planning, and resource allocation. By integrating drone surveys with other data sources, you'll gain an extensive understanding of your city's density dynamics, leading to more efficient and sustainable urban planning strategies.
Visual Impact Studies Using Drones
How can urban planners truly understand the visual impact of proposed developments? Enter drones equipped with high-resolution cameras and 3D modeling capabilities. These aerial tools offer a game-changing perspective for visual impact studies.
You'll find that drones can capture detailed imagery from various angles and altitudes, providing an extensive view of how new structures might affect the existing cityscape. They'll allow you to create accurate 3D models of proposed buildings within their urban context, helping you visualize height, scale, and shadows.
With drone-captured data, you can generate realistic renderings and fly-through animations. These visuals will help you communicate potential impacts to stakeholders and the public more effectively. You'll be able to assess how new developments might obstruct views, alter the skyline, or affect the character of historic districts.
Moreover, drones enable you to conduct before-and-after comparisons, tracking changes in the urban landscape over time. This temporal aspect is vital for long-term planning and evaluating the cumulative effects of multiple projects.
Environmental Analysis Through Aerial Imagery

Aerial imagery revolutionizes environmental analysis in urban planning. You'll find that high-resolution photos and multispectral imaging from drones or satellites provide a wealth of data for informed zoning decisions.
These tools allow you to evaluate vegetation health, identify heat islands, and monitor water resources with unprecedented accuracy.
When you're examining environmental factors for urban zoning, aerial imagery helps you:
- Detect changes in land use over time, revealing trends in urban sprawl or green space reduction
- Identify potential contamination sites by analyzing soil discoloration or vegetation stress patterns
- Evaluate flood risks by mapping low-lying areas and tracking historical water level changes
You'll appreciate how this technology enables you to create detailed vegetation maps, distinguishing between different tree species and evaluating overall canopy coverage.
It's also invaluable for monitoring air quality, as you can track pollution plumes and their dispersion patterns.
By integrating this data with other urban planning metrics, you'll make more environmentally conscious zoning decisions.
Aerial imagery doesn't just provide a bird's-eye view; it offers a thorough understanding of your city's ecological health, guiding you towards sustainable urban development strategies.
Traffic Flow Visualization Techniques

Visualizing traffic flow is an essential component of effective urban zoning. You'll find several techniques that can help you understand and analyze traffic patterns in urban areas.
One of the most common methods is heat mapping, where you use color gradients to represent traffic density. Red often indicates high congestion, while green shows free-flowing traffic.
Another useful technique is time-lapse imagery. By compressing hours of traffic footage into a short video, you can easily spot patterns and bottlenecks. This method is particularly effective for identifying rush hour trends and weekend traffic variations.
Vector flow fields are also powerful tools. They use arrows to show the direction and speed of traffic, giving you a clear picture of how vehicles move through the city.
For a more detailed analysis, you can employ GPS data visualization. This technique uses real-time data from vehicles to create accurate, up-to-the-minute traffic flow maps.
Lastly, 3D modeling can help you visualize how proposed zoning changes might affect traffic flow. By creating virtual models of new road layouts or building developments, you can predict and mitigate potential traffic issues before they occur.
Infrastructure Planning With Drone Data
Drone technology has revolutionized infrastructure planning in urban areas. You can now gather high-resolution imagery and 3D models of cityscapes, providing invaluable data for zoning decisions.
These aerial perspectives offer insights that ground-level surveys can't match, allowing you to visualize potential developments and their impact on existing structures.
When using drone data for infrastructure planning, you'll want to focus on:
- Topographical analysis: Drones can capture detailed elevation data, helping you identify suitable areas for construction and potential drainage issues.
- Building height and density mapping: Aerial imagery allows you to assess current building heights and plan for future vertical growth in line with zoning regulations.
- Green space evaluation: You can easily identify and measure existing green areas, aiding in the planning of parks and urban forests.
Green Space Mapping Strategies
Green space mapping strategies are vital for effective urban planning and environmental management. You'll find that these strategies rely heavily on remote sensing technologies and geographic information systems (GIS) to accurately identify and analyze urban green spaces.
To map green spaces effectively, you should use high-resolution satellite imagery or aerial photography. These tools allow you to distinguish between different types of vegetation, from large parks to small private gardens. You can also employ LiDAR (Light Detection and Ranging) data to create 3D models of tree canopies and assess their density and health.
When mapping green spaces, it's important to take into account their distribution, accessibility, and quality. You'll want to use spatial analysis techniques to evaluate the proximity of green spaces to residential areas and identify underserved neighborhoods.
Additionally, you should incorporate data on biodiversity, air quality, and temperature to assess the ecological value of these spaces.
Frequently Asked Questions
How Does Historical Imagery Influence Modern Urban Zoning Decisions?
Historical imagery greatly impacts your modern urban zoning decisions. You'll use old photos and maps to understand past land use, architectural styles, and development patterns. This insight helps you make informed choices about preserving heritage and guiding future growth.
What Role Does Public Participation Play in Interpreting Urban Imagery Data?
You'll find public participation essential in interpreting urban imagery data. It brings diverse perspectives, local knowledge, and community values to the table. You're empowering residents to shape their neighborhoods and ensuring more inclusive decision-making processes.
How Are Privacy Concerns Addressed When Collecting Detailed Urban Imagery?
You'll find privacy concerns are addressed through data anonymization, blurring faces and license plates, and obtaining consent. You're also protected by strict data handling protocols and limited access to sensitive information. Public notification is often required.
What Are the Cost Implications of Implementing Advanced Imagery Techniques for Zoning?
You'll face significant upfront costs for advanced imagery techniques in zoning. They'll require specialized equipment, software, and trained personnel. However, you'll likely see long-term savings through more efficient planning and reduced errors in zoning decisions.
How Do Cultural Factors Affect the Interpretation of Urban Imagery for Zoning?
You'll find that cultural factors heavily influence how urban imagery is interpreted for zoning. Your background shapes your perception of space, aesthetics, and land use. It's essential to take into account diverse perspectives when making zoning decisions.
In Summary
You've explored a range of powerful imaging tools for urban zoning. From aerial views to 3D models, you're now equipped to make informed decisions. Remember, it's not just about one type of imagery, but a combination that'll give you the fullest picture. Whether you're analyzing traffic flow or mapping green spaces, you'll find these visual techniques invaluable. Use them wisely, and you'll shape cities that are both functional and livable.
As educators and advocates for responsible drone use, we’re committed to sharing our knowledge and expertise with aspiring aerial photographers.
Leave a Reply