Mapping plays an essential role in flood risk evaluation by providing important tools for understanding, predicting, and mitigating flood hazards. You'll find it imperative for visualizing historical flood data, creating topographic maps of flood zones, and developing digital elevation models. It enables real-time monitoring during flood events, supports hydrological modeling, and aids in emergency response planning. Mapping also helps assess post-flood damage, plan recovery efforts, and evaluate climate change impacts on flooding. From identifying vulnerable areas to designing effective mitigation strategies, mapping techniques offer invaluable insights for communities and decision-makers. Exploring these mapping applications can considerably enhance your flood risk management approach.
Historical Flood Data Visualization
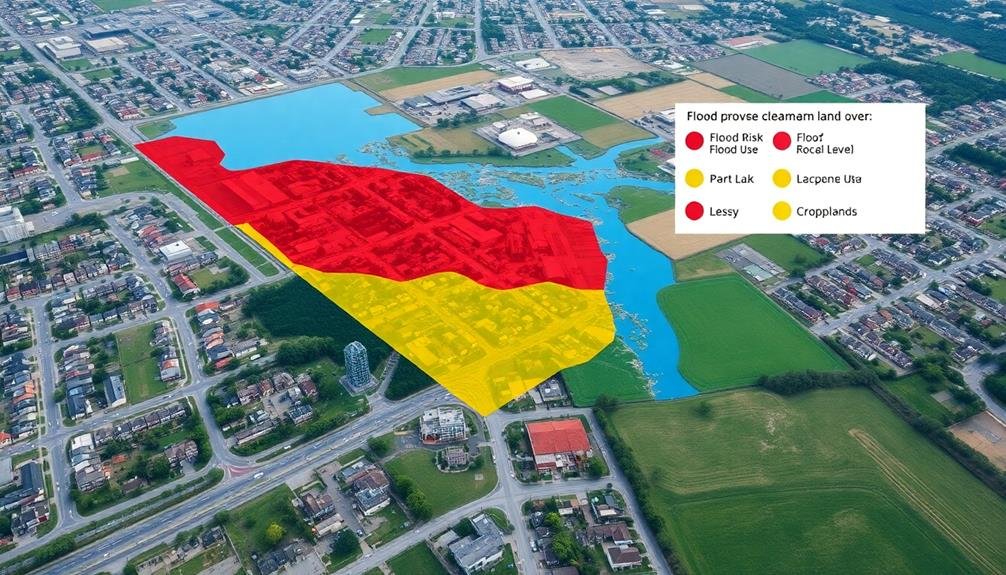
Historical flood data visualization plays an essential role in understanding past flooding events and their impacts. By creating visual representations of historical flood data, you can identify patterns, trends, and high-risk areas more easily. These visualizations often include maps showing the extent of previous floods, water depth, and duration.
You'll find that historical flood data visualization typically incorporates various data sources, such as satellite imagery, aerial photographs, and ground-based observations. These are combined to create thorough flood maps that illustrate how water has moved across landscapes over time.
When you're working with historical flood data, you'll often use Geographic Information Systems (GIS) to overlay multiple layers of information. This allows you to analyze the relationship between flooding and factors like topography, land use, and infrastructure.
By visualizing historical flood data, you can:
- Identify flood-prone areas
- Assess the effectiveness of existing flood defenses
- Plan future flood mitigation strategies
- Educate the public about flood risks
- Support insurance risk assessments
Ultimately, historical flood data visualization helps you make informed decisions about land use planning, emergency response, and infrastructure development to reduce future flood risks.
Topographic Mapping for Flood Zones

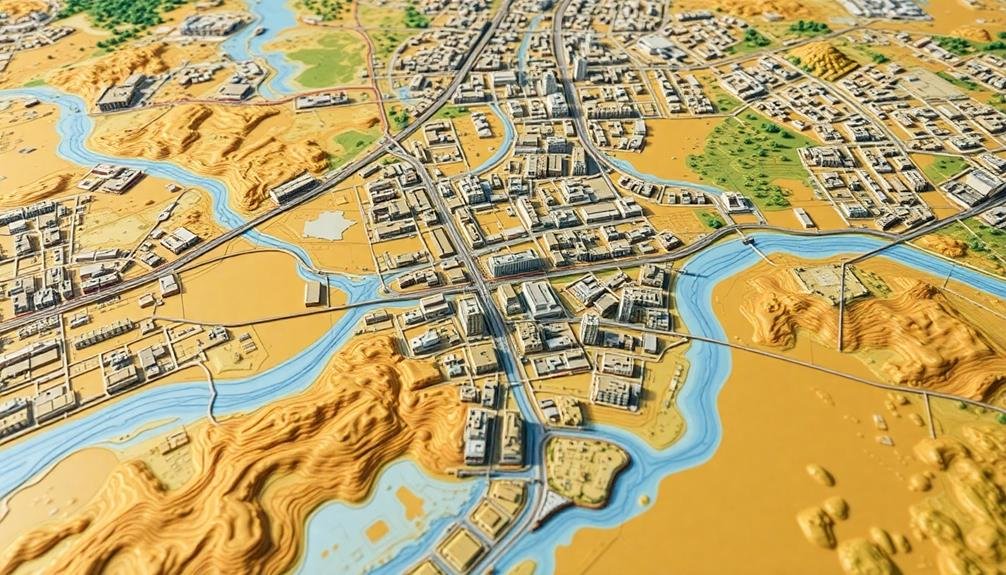
When evaluating flood risks, topographic mapping plays an essential role in identifying and delineating flood zones. You'll find that these maps provide significant information about an area's elevation, slope, and terrain features. By analyzing topographic data, you can pinpoint low-lying areas prone to flooding and identify natural barriers that might protect certain regions.
Topographic maps use contour lines to represent changes in elevation, allowing you to visualize the landscape's three-dimensional characteristics. This information is critical for determining how water will flow and accumulate during flood events. You'll be able to trace potential flood paths and estimate the extent of inundation based on different water levels.
Modern technology has enhanced topographic mapping capabilities. LiDAR (Light Detection and Ranging) systems can create highly accurate digital elevation models, providing even more precise data for flood risk assessment.
You can use these detailed maps to develop flood simulation models, design effective drainage systems, and plan appropriate flood mitigation strategies.
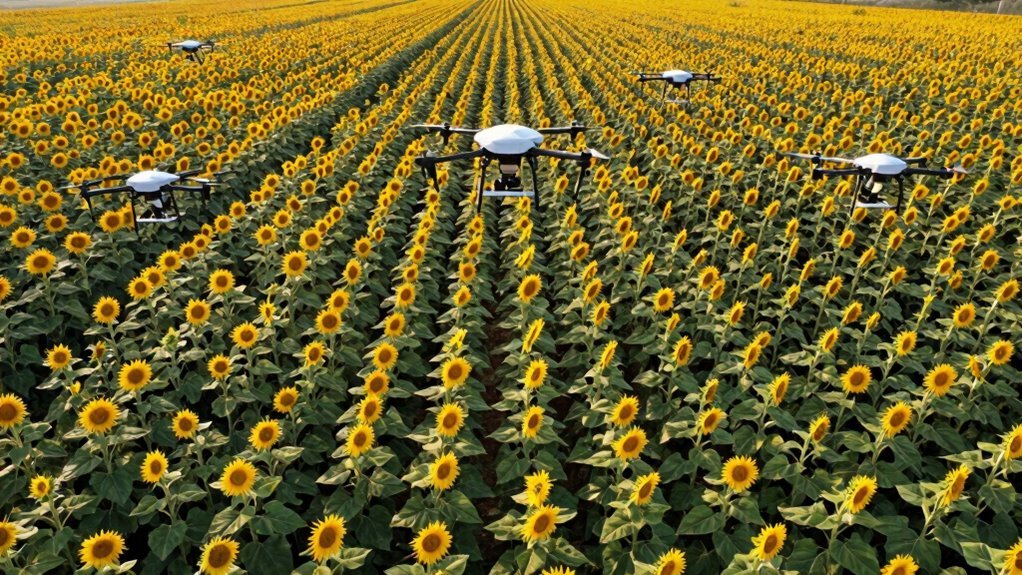
Hydrological Modeling With Drones
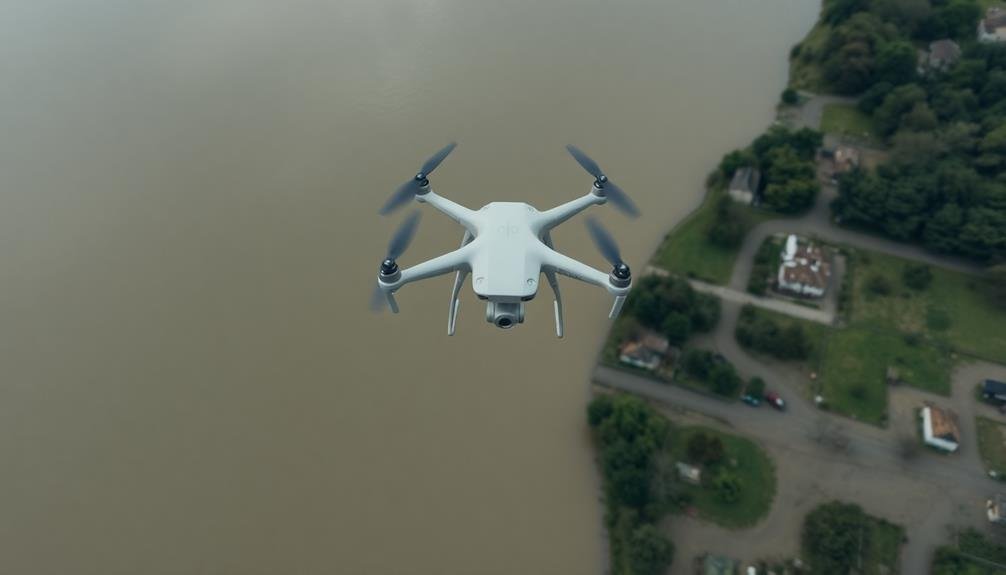
You'll find drones revolutionizing hydrological modeling through their ability to collect precise terrain data.
These unmanned aerial vehicles can provide real-time flood monitoring, giving you up-to-the-minute information during critical events.
With enhanced predictive capabilities, you're better equipped to assess flood risks and plan accordingly.
Precise Terrain Data Collection
Drones have revolutionized the way we collect precise terrain data for hydrological modeling. You'll find that these unmanned aerial vehicles can capture high-resolution imagery and create detailed digital elevation models (DEMs) with unprecedented accuracy. By using drones, you're able to survey large areas quickly and efficiently, even in hard-to-reach locations.
When you're collecting terrain data with drones, you'll typically use LiDAR (Light Detection and Ranging) or photogrammetry techniques. LiDAR sensors emit laser pulses to measure distances and create 3D point clouds, while photogrammetry uses overlapping images to construct 3D models. Both methods provide you with centimeter-level accuracy, which is essential for flood risk assessment.
You'll appreciate how drones can capture subtle changes in topography that might be missed by traditional surveying methods. This level of detail allows you to identify potential flow paths, depressions, and other terrain features that influence flood behavior.
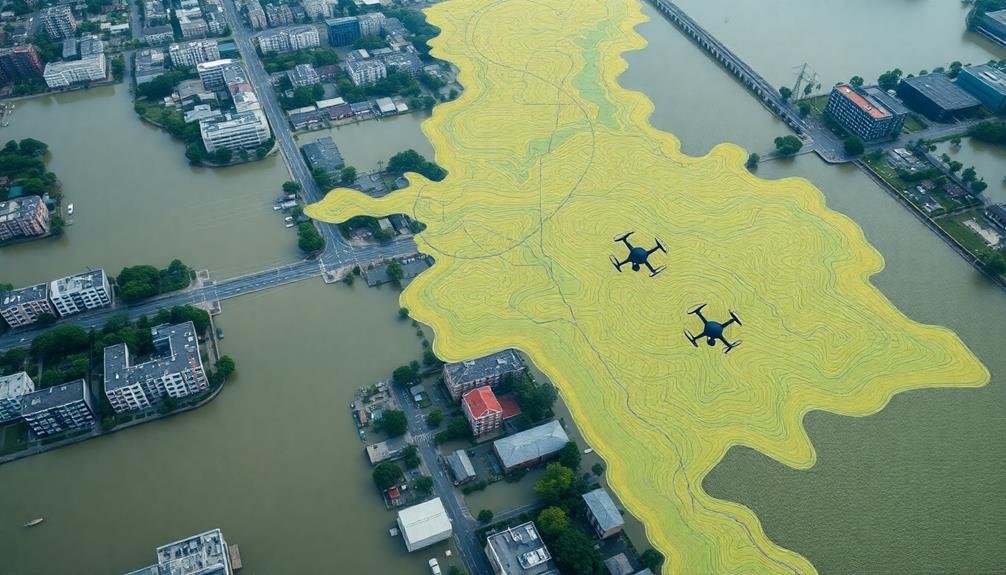
Real-Time Flood Monitoring
As flood events unfold, real-time monitoring with drones provides essential information for emergency responders and decision-makers. You'll find that drones equipped with advanced sensors and cameras can quickly survey large areas, capturing high-resolution imagery and data that's vital for evaluating the extent and severity of flooding.
These unmanned aerial vehicles allow you to track water levels, identify breached levees, and locate stranded individuals or communities in need of assistance. They're particularly useful in areas that are difficult or dangerous to access by ground.
You can integrate the data collected by drones into hydrological models, enhancing their accuracy and predictive capabilities. This real-time information helps you forecast flood progression, estimate potential impacts, and make informed decisions about evacuation orders or resource allocation.
Moreover, you'll benefit from the ability to monitor changes in vegetation, soil moisture, and land use patterns over time. This long-term data collection supports more thorough flood risk evaluations and helps you develop more effective mitigation strategies.
Enhanced Predictive Capabilities
Numerous advancements in hydrological modeling have been made possible through the integration of drone-collected data. You'll find that drones equipped with high-resolution cameras and LiDAR sensors can capture detailed topographic information, enabling more accurate flood predictions. These aerial surveys provide up-to-date data on terrain changes, vegetation cover, and urban development, all of which influence water flow patterns.
By incorporating drone-collected data into hydrological models, you can:
| Benefit | Impact |
|---|---|
| Improve accuracy | More precise flood extent predictions |
| Enhance resolution | Detailed mapping of flood-prone areas |
| Update frequently | Capture recent landscape changes |
| Reduce costs | Efficient data collection compared to traditional methods |
This enhanced predictive capability allows you to better anticipate flood risks and plan accordingly. You'll be able to identify vulnerable areas with greater precision, enabling targeted mitigation efforts. Additionally, you can use these models to simulate various flood scenarios, helping you develop more effective emergency response plans. By leveraging drone technology in hydrological modeling, you're not just improving flood risk evaluation; you're also empowering communities to build resilience against future flood events.
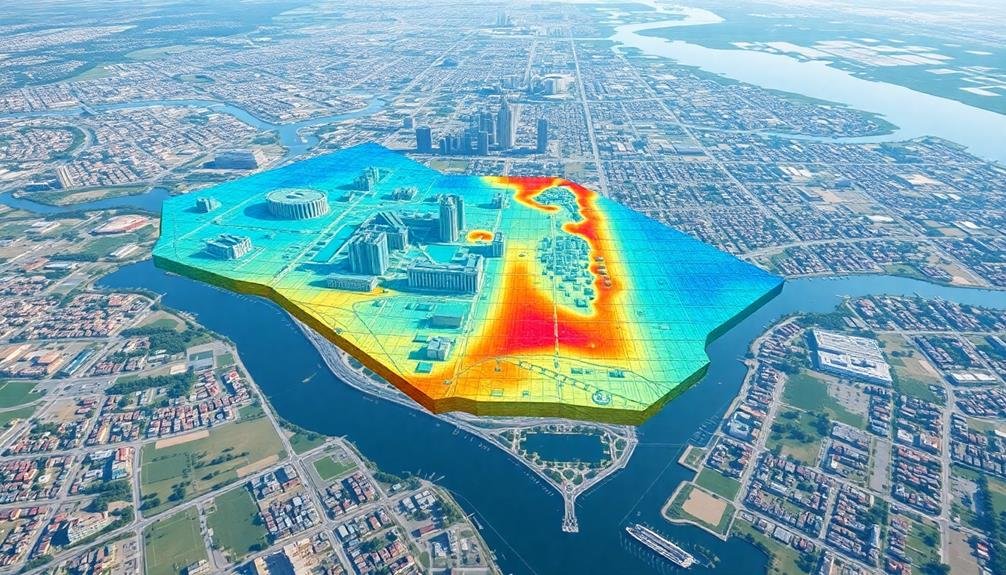
Real-Time Flood Extent Mapping
Real-time flood extent mapping has revolutionized our ability to respond to flooding events. This technology allows you to track the spread of floodwaters as they occur, providing essential information for emergency responders and affected communities.
You'll find that satellite imagery, aerial photography, and ground-based sensors are combined to create accurate, up-to-the-minute maps of inundated areas. These maps can be updated continuously, giving you a clear picture of how the flood is progressing and which areas are at immediate risk.
With real-time flood extent mapping, you can:
- Identify safe evacuation routes
- Direct rescue efforts to the most vital areas
- Assess damage to infrastructure in real-time
- Make informed decisions about resource allocation
This technology also helps you validate and improve flood models by comparing predictions with actual flood extents. You'll be able to refine your understanding of flood behavior and improve future predictions.
Digital Elevation Models (DEMs)

Digital Elevation Models (DEMs) form the backbone of accurate flood risk assessment and mapping. These 3D representations of terrain surfaces provide essential topographic data for understanding how water will flow and accumulate during flood events.
You'll find that high-resolution DEMs are vital for creating precise flood models and inundation maps. When you're working with DEMs, you're dealing with gridded elevation data that can be derived from various sources, including LiDAR, photogrammetry, and satellite imagery.
The higher the resolution of your DEM, the more accurate your flood predictions will be. You'll want to use DEMs with a resolution of at least 1-meter for urban areas and 5-10 meters for rural regions.
By incorporating DEMs into your flood risk evaluation, you can:
- Identify low-lying areas prone to flooding
- Calculate water depths and velocities
- Determine flow paths and catchment areas
- Assess the impact of infrastructure on flood behavior
Land Use and Cover Analysis
Land use and cover analysis provides essential insights into flood risk factors.
You'll identify impervious surfaces, assess vegetation density, and monitor urban expansion to understand water absorption and runoff patterns.
These analyses help you pinpoint areas at higher risk of flooding and inform flood mitigation strategies.
Impervious Surface Identification
A essential component of flood risk assessment is the identification of impervious surfaces through land use and cover analysis. These surfaces, like roads, parking lots, and buildings, don't allow water to infiltrate the ground, increasing runoff and flood potential.
You'll use various mapping techniques to identify and quantify these areas. High-resolution satellite imagery and aerial photographs are your primary tools. You'll employ image classification algorithms to distinguish impervious surfaces from vegetation and bare soil.
Machine learning techniques, such as supervised and unsupervised classification, can help automate this process. You'll also use LiDAR data to create detailed digital elevation models, which can reveal subtle changes in surface characteristics.
This data helps you identify smaller impervious features that might be missed in traditional imagery. Once you've mapped impervious surfaces, you'll calculate the impervious surface ratio for different catchment areas.
This ratio is essential for understanding how quickly rainwater will become runoff. Areas with high impervious surface ratios are more prone to flash flooding and require special attention in your flood risk evaluation.
Vegetation Density Assessment
While impervious surfaces increase flood risk, vegetation plays a key role in mitigating it. Vegetation density evaluation is essential in determining an area's flood resilience. You'll need to analyze satellite imagery, aerial photographs, and ground surveys to accurately map vegetation coverage.
When examining vegetation density, consider these factors:
- Canopy cover
- Root systems
- Leaf area index
- Species composition
- Vegetation health
Dense vegetation intercepts rainfall, slowing its path to the ground and reducing surface runoff. It also improves soil structure and increases water infiltration rates. You'll find that areas with higher vegetation density typically have lower flood risk.
To quantify vegetation density, you'll use remote sensing techniques like NDVI (Normalized Difference Vegetation Index). This helps you create detailed maps showing variations in vegetation cover across landscapes.
You'll also need to account for seasonal changes, as vegetation density fluctuates throughout the year.
Urban Expansion Monitoring
Rapidly expanding urban areas considerably impact flood risk dynamics. As cities grow, you'll find that mapping plays a significant role in monitoring urban expansion and its effects on flood vulnerability.
By using satellite imagery and aerial photography, you can track changes in land use over time, identifying areas where natural landscapes are being replaced by impervious surfaces.
You'll want to focus on creating detailed land cover maps that distinguish between various urban features, such as buildings, roads, and green spaces. These maps help you assess how urbanization alters natural drainage patterns and increases surface runoff.
You can also use them to identify areas where development encroaches on floodplains or wetlands, potentially exacerbating flood risks.
Drainage Network Identification

To accurately evaluate flood risk, identifying the drainage network is an essential step in the mapping process. You'll need to use various data sources and techniques to map out the intricate system of rivers, streams, canals, and other water channels that make up the drainage network. This information is vital for understanding how water flows through an area during heavy rainfall or flooding events.
When identifying drainage networks, you'll want to take into account:
- Topographic data
- Satellite imagery
- LiDAR (Light Detection and Ranging) data
- Historical flood records
- Field surveys
By combining these data sources, you can create an exhaustive map of the drainage network. This map will help you identify potential bottlenecks, areas prone to overflow, and the overall capacity of the system to handle various water volumes.
You'll also need to take into account artificial drainage systems, such as storm sewers and culverts, which play a significant role in urban flood management. By mapping these elements alongside natural waterways, you'll get a more accurate picture of how water moves through the landscape.
This information is invaluable for predicting flood paths, evaluating vulnerable areas, and developing effective flood mitigation strategies.
Floodplain Delineation Techniques
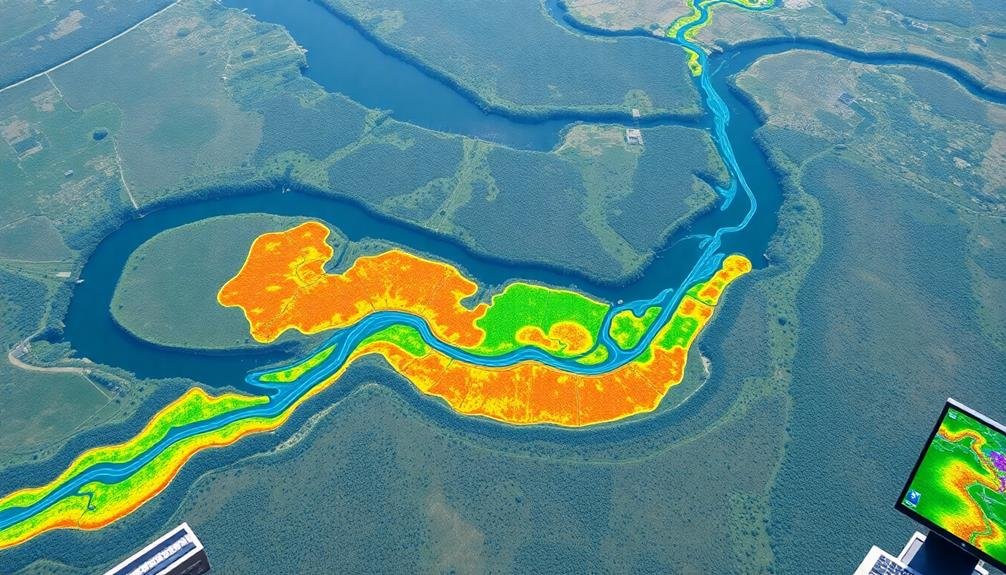
Once you've identified the drainage network, the next significant step in flood risk evaluation is floodplain delineation. This process involves mapping out areas that are likely to be inundated during flood events.
You'll use various techniques to achieve this, including hydraulic modeling, historical flood data analysis, and remote sensing.
Hydraulic modeling simulates water flow and helps predict flood extents based on topography and river characteristics. You'll input data on channel geometry, roughness, and flow rates to generate flood maps for different scenarios.
Historical flood data provides valuable insights into past inundation patterns, which you can use to validate and refine your models.
Remote sensing techniques, such as LiDAR and satellite imagery, offer high-resolution terrain data for accurate floodplain mapping. You'll analyze these datasets to identify low-lying areas prone to flooding.
Geographic Information Systems (GIS) play a vital role in integrating and visualizing all this information.
You'll also consider factors like land use, soil types, and climate change projections to create thorough floodplain maps. These maps will help planners, policymakers, and property owners make informed decisions about flood risk management and mitigation strategies.
Urban Flood Risk Assessment
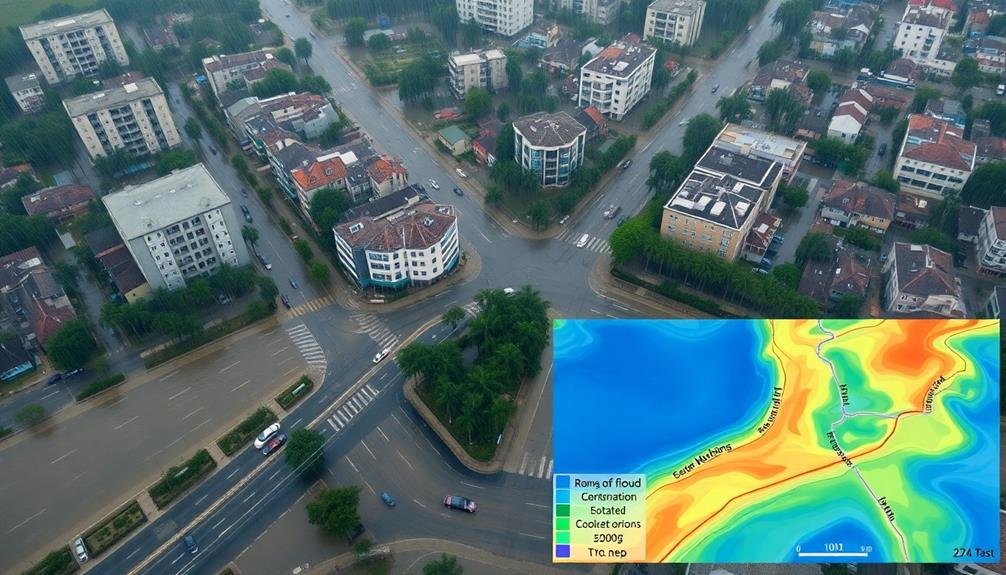
In urban areas, flood risk evaluation takes on unique challenges due to the complex interplay of built environments and natural systems. You'll need to take into account various factors when examining flood risks in cities, including infrastructure capacity, land use patterns, and population density.
Urban flood mapping involves advanced techniques that account for:
- Impervious surfaces and their impact on runoff
- Stormwater drainage systems and their efficiency
- Building footprints and their vulnerability to flooding
- Essential infrastructure locations and potential disruptions
- Socioeconomic factors affecting community resilience
You'll find that high-resolution LiDAR data and detailed hydrological models are vital for accurate urban flood risk evaluation. These tools help you identify flood-prone areas, estimate potential damages, and develop targeted mitigation strategies.
When evaluating urban flood risks, you must also take into account the dynamic nature of cities. Rapid urbanization, changing land use patterns, and aging infrastructure can greatly alter flood risks over time.
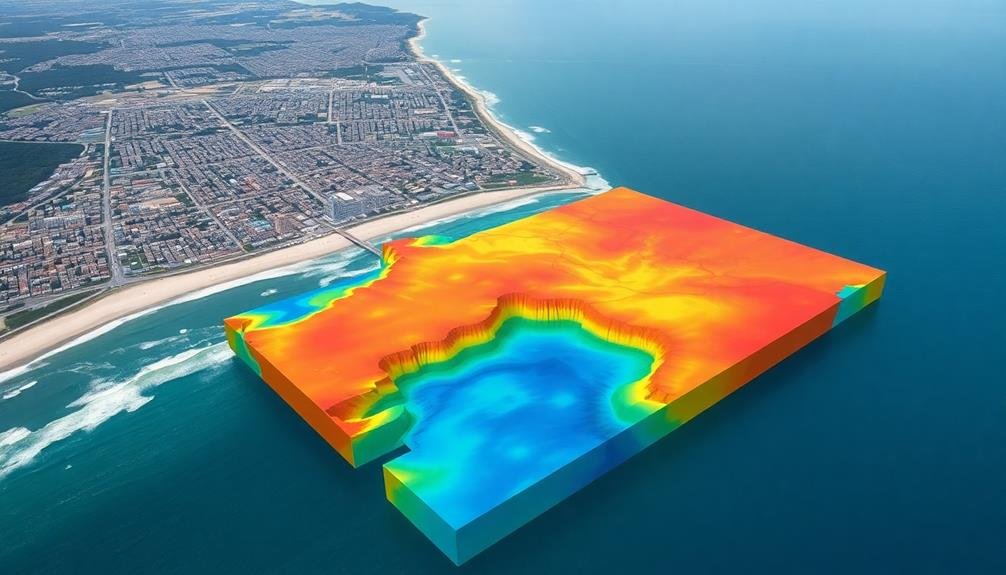
Coastal Inundation Mapping

Coastal inundation mapping stands out from among the various flood risk evaluation techniques due to its unique challenges and vital importance. You'll find that this specialized form of mapping focuses on the complex interplay between sea-level rise, storm surges, and coastal topography. It's essential for identifying vulnerable areas along coastlines and predicting potential flood extents.
When you're working on coastal inundation mapping, you'll need to take into account factors like tidal patterns, wave dynamics, and long-term sea-level trends. You'll use high-resolution elevation data, often obtained through LiDAR technology, to create detailed digital elevation models of coastal areas. These models serve as the foundation for your inundation simulations.
You'll also incorporate data on historical storm events, projected climate change scenarios, and local infrastructure into your mapping process. By doing so, you're able to generate maps that show potential flood depths and extents under various conditions.
These maps are vital for coastal communities, helping them develop effective evacuation plans, update building codes, and make informed decisions about future development. They're also invaluable tools for insurance companies, urban planners, and policymakers in evaluating and mitigating coastal flood risks.
Flood Mitigation Planning

When planning for flood mitigation, you'll first need to identify vulnerable areas using detailed mapping data.
You can then use this information to develop effective evacuation routes, ensuring residents can safely leave flood-prone zones.
Identifying Vulnerable Areas
By means of advanced mapping techniques, flood mitigation planners can pinpoint areas most at risk of inundation.
These tools allow you to visualize topography, elevation, and water flow patterns, helping identify low-lying regions and natural drainage systems.
You'll be able to assess the proximity of vulnerable areas to water bodies and analyze historical flood data to predict future risks.
When identifying vulnerable areas, consider the following factors:
- Topography and elevation
- Proximity to rivers, lakes, and coastlines
- Soil composition and permeability
- Land use and development patterns
- Existing flood control infrastructure
Evacuation Route Planning
Effective evacuation route planning is an important component of flood mitigation strategies. When you're developing evacuation routes, you'll need to take into account various factors to guarantee the safety of residents during a flood event. These include topography, road networks, population density, and potential flood depths.
Mapping technologies play a significant role in this process. They allow you to visualize and analyze data to create the best evacuation routes. You'll use GIS tools to identify high-ground areas, assess road capacities, and determine the fastest and safest paths away from flood-prone zones.
Here's a breakdown of key considerations in evacuation route planning:
| Factor | Importance |
|---|---|
| Elevation | Critical |
| Road capacity | High |
| Bridge stability | High |
| Traffic flow | Medium |
| Shelter locations | Medium |
Infrastructure Protection Strategies
While evacuation planning is crucial, protecting critical infrastructure is equally important in flood mitigation efforts. You'll need to identify and prioritize key facilities such as hospitals, power plants, water treatment facilities, and transportation hubs. Using flood risk maps, you can assess the vulnerability of these structures and implement protective measures.
To safeguard critical infrastructure, consider the following strategies:
- Elevating essential equipment and systems above projected flood levels
- Installing flood barriers or floodwalls around vulnerable facilities
- Implementing waterproofing techniques for buildings and equipment
- Developing backup power systems and redundant communication networks
- Creating drainage systems to divert floodwaters away from critical areas
You'll also want to integrate these protection strategies into your community's long-term development plans. This might involve updating building codes, zoning regulations, and land use policies to account for flood risks.
By incorporating flood-resistant design principles into new construction and retrofitting existing structures, you can meaningfully reduce the potential impact of flooding on crucial infrastructure.
Emergency Response Mapping

During emergencies, every second counts. Emergency response mapping plays an essential role in flood risk evaluation by providing real-time information to first responders and decision-makers.
You'll find that these maps integrate various data sources, including weather forecasts, river levels, and topography, to create an all-encompassing picture of the unfolding situation.
As floodwaters rise, you can use these maps to identify at-risk areas, plan evacuation routes, and allocate resources effectively. They'll show you the locations of vulnerable populations, critical infrastructure, and potential shelter sites.
You'll also be able to track the movement of emergency vehicles and personnel, ensuring a coordinated response.
Modern emergency response maps often incorporate live data feeds from sensors and satellites, giving you up-to-the-minute updates on flood conditions. You can use this information to make informed decisions about road closures, dam operations, and rescue priorities.
Additionally, these maps can be shared across multiple agencies and platforms, facilitating seamless communication and collaboration during the crisis.
Post-Flood Damage Assessment
After a flood subsides, you'll need to assess the damage quickly and accurately.
Using aerial imagery analysis, you can quantify the extent of the affected areas and pinpoint severely impacted locations.
This thorough damage assessment supports recovery planning efforts, helping prioritize resources and guiding reconstruction initiatives.
Aerial Imagery Analysis
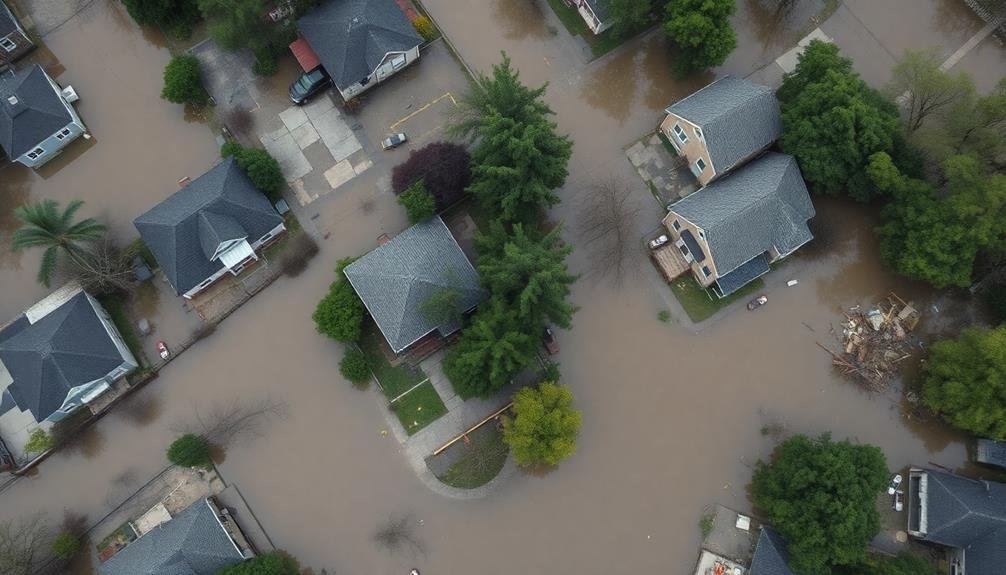
Aerial imagery analysis steps up to the plate when it comes to post-flood damage assessment. You'll find it's an invaluable tool for quickly evaluating large areas affected by flooding.
By using high-resolution images captured from aircraft or satellites, you can assess the extent of damage without putting boots on the ground.
This method allows you to:
- Identify submerged areas and estimate flood depths
- Detect structural damage to buildings and infrastructure
- Assess the impact on agricultural land and crops
- Monitor changes in river channels and coastlines
- Locate potential hazards such as debris fields or landslides
You'll appreciate how aerial imagery analysis provides a bird's-eye view of the affected region, helping you prioritize response efforts and allocate resources efficiently.
It's particularly useful for reaching remote or inaccessible areas where ground surveys might be challenging or dangerous.
Damage Extent Quantification
Building on the insights gained from aerial imagery analysis, damage extent quantification takes flood assessment to the next level. You'll use advanced mapping techniques to measure and categorize the scope of destruction caused by flooding events. This process involves integrating data from various sources, including satellite imagery, ground surveys, and historical flood records.
To quantify damage extent, you'll typically follow these steps:
- Overlay flood inundation maps with property and infrastructure data
- Categorize affected areas based on severity of damage
- Calculate economic losses using property values and damage assessments
Here's a breakdown of damage categories and their implications:
| Damage Category | Description | Economic Impact |
|---|---|---|
| Minor | Minimal structural damage | Low repair costs |
| Moderate | Partial structural damage | Significant repairs needed |
| Severe | Extensive structural damage | Potential total loss |
Recovery Planning Support
Leveraging the extensive damage assessment data, recovery planning support becomes an important next step in post-flood management. You'll find that mapping tools play a significant role in this phase, helping you visualize and prioritize recovery efforts. By overlaying damage data with infrastructure maps, you can quickly identify vital areas that need immediate attention.
Recovery planning support through mapping allows you to:
- Allocate resources efficiently based on damage severity
- Identify safe zones for temporary housing and aid distribution
- Plan reconstruction efforts with updated flood risk information
- Coordinate with various agencies and stakeholders using shared map data
- Track recovery progress over time with regular map updates
You'll also use these maps to communicate recovery plans to the public, guaranteeing transparency and community involvement.
By incorporating socioeconomic data into your recovery maps, you can prioritize assistance to vulnerable populations. Additionally, you'll find that mapping aids in long-term flood mitigation planning, helping you identify areas where infrastructure improvements or land-use changes are necessary.
This data-driven approach guarantees that your recovery efforts not only address immediate needs but also contribute to building a more resilient community for future flood events.
Climate Change Impact Mapping
Climate change impact mapping has become an essential tool in flood risk assessment. It allows you to visualize how rising temperatures, changing precipitation patterns, and sea-level rise affect flood-prone areas. You'll use this mapping technique to project future scenarios and identify regions that may become increasingly vulnerable to flooding.
When creating climate change impact maps, you'll incorporate data from climate models, historical records, and topographical information. These maps often display potential changes in flood frequency, intensity, and extent.
You can overlay this information with population density, infrastructure, and economic assets to assess the potential impacts on communities.
You'll find that climate change impact mapping helps decision-makers prioritize adaptation strategies and allocate resources effectively. It enables you to identify areas where flood defenses may need to be strengthened or where land-use planning should be adjusted.
Additionally, these maps can inform long-term urban planning, guiding the development of climate-resilient infrastructure and communities.
Frequently Asked Questions
How Accurate Are Flood Risk Maps Compared to Actual Flood Events?
You'll find that flood risk maps are generally accurate, but they're not perfect. They can't predict every scenario. Actual flood events may differ due to changing landscapes, climate shifts, or unexpected weather patterns. Always stay alert to local conditions.
What Role Does Artificial Intelligence Play in Flood Risk Mapping?
AI enhances your flood risk mapping by analyzing vast datasets, identifying patterns, and predicting future flood events. It'll improve accuracy, speed up assessments, and help you create more detailed, real-time maps for better decision-making and preparedness.
How Often Should Flood Risk Maps Be Updated?
You should update flood risk maps regularly, ideally every 3-5 years. However, you'll need to update them more frequently if there are significant changes in land use, climate patterns, or infrastructure development in your area.
Can Individuals Contribute to Flood Risk Mapping Through Citizen Science Initiatives?
Yes, you can contribute to flood risk mapping through citizen science. You'll gather local data, report flood events, and share observations. Your input helps improve map accuracy and enhances community awareness of flood risks in your area.
How Do Insurance Companies Use Flood Risk Maps to Determine Premiums?
Insurance companies rely on flood risk maps to assess property vulnerability. They'll analyze your location's flood zones, elevation, and historical data to calculate premiums. Higher-risk areas typically face steeper rates, reflecting increased potential for claims.
In Summary
You've seen how mapping plays a vital role in flood risk evaluation. From visualizing historical data to creating real-time flood extent maps, it's an essential tool. You'll use it for everything from topographic analysis to emergency response planning. As climate change impacts intensify, you'll rely even more on advanced mapping techniques. Remember, accurate maps are your key to understanding, predicting, and mitigating flood risks in your community. Keep updating and improving your mapping capabilities.
As educators and advocates for responsible drone use, we’re committed to sharing our knowledge and expertise with aspiring aerial photographers.


Leave a Reply