Drones are revolutionizing urban heat island mapping with advanced technologies. You'll find thermal imaging sensors capturing precise temperature variations and multi-spectral cameras evaluating vegetation health. LiDAR integration enables 3D terrain analysis, while high-resolution aerial photography provides visual context. GPS-enabled mapping pinpoints heat anomalies accurately. Automated flight patterns guarantee consistent data collection, and machine learning analyzes vast datasets. Time-series heat mapping reveals dynamic temperature changes. These innovations offer cost-effective, flexible, and accessible solutions for understanding urban heat dynamics. By leveraging these drone capabilities, you're revealing powerful insights into city microclimates and their impacts on urban life.
Thermal Imaging Sensors
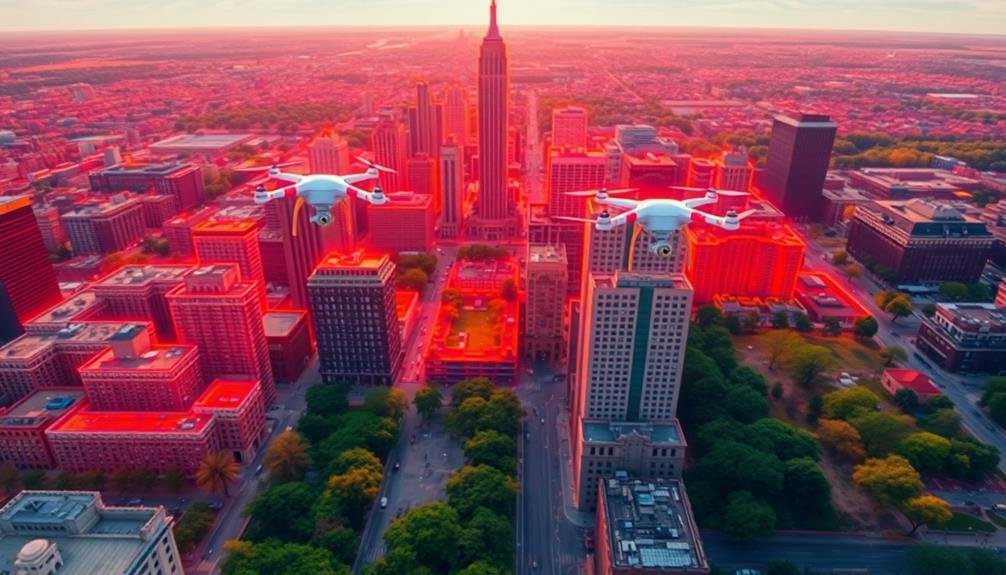
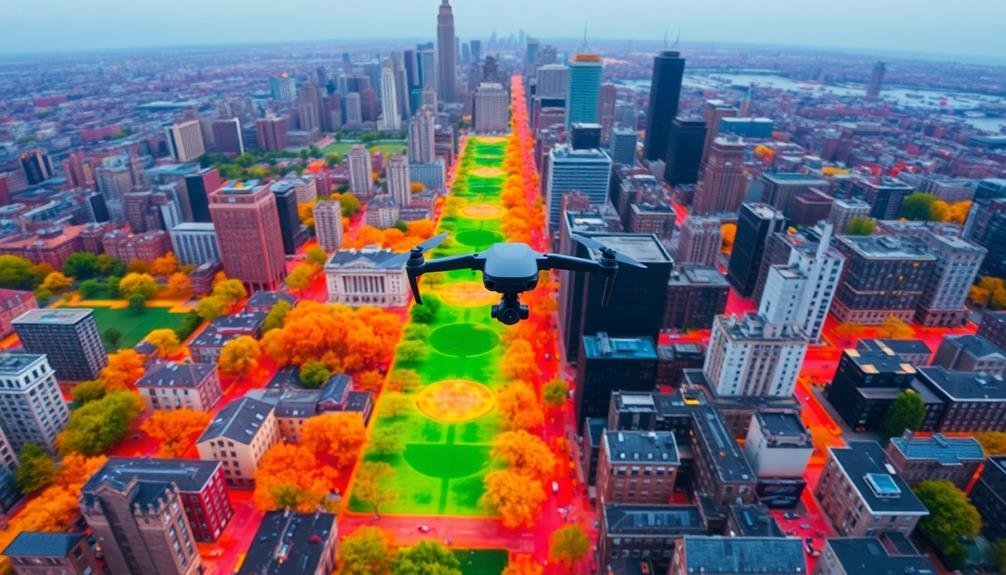
To accurately map urban heat islands, drones equipped with thermal imaging sensors play an essential role. These advanced sensors capture infrared radiation emitted by surfaces, allowing you to visualize temperature variations across urban landscapes. As the drone flies over an area, it creates a detailed thermal map, highlighting hot spots and cooler regions.
You'll find that thermal imaging sensors can detect temperature differences as small as 0.1°C, providing highly precise data. They work by measuring the infrared energy emitted by objects and converting it into a visible image. This technology enables you to identify heat-absorbing materials, such as asphalt and concrete, which contribute to the urban heat island effect.
When using drones with thermal sensors, you can collect data at various times of day and night, revealing how heat patterns change over time. This temporal aspect is vital for understanding the dynamics of urban heat islands.
Additionally, you can compare thermal images of different neighborhoods, helping city planners identify areas that need more green spaces or reflective surfaces to mitigate heat. By leveraging this technology, you're able to create extensive heat maps that inform urban planning and climate adaptation strategies.
Multi-Spectral Cameras
Multi-spectral cameras on drones enhance urban heat island mapping by capturing data across multiple light wavelengths.
You'll find these cameras can detect thermal variations with high precision, complementing the capabilities of thermal imaging sensors.
Additionally, they'll allow you to assess vegetation health, providing essential insights into the relationship between green spaces and urban heat patterns.
Thermal Imaging Capabilities
Thermal imaging capabilities form the backbone of drone-based urban heat island mapping. These specialized cameras allow you to capture infrared radiation emitted by surfaces, translating heat signatures into visual data.
You'll find that drones equipped with thermal sensors can detect temperature variations across urban landscapes with remarkable precision.
When you're mapping heat islands, thermal imaging enables you to identify hotspots and cool zones within cities. You'll be able to pinpoint areas where heat accumulates, such as asphalt parking lots, dark roofs, or industrial zones.
Conversely, you can also locate cooler areas like parks, water bodies, or green spaces that help mitigate urban heat.
The high resolution of modern thermal cameras lets you capture detailed temperature gradients. You'll notice how different materials and surfaces emit heat differently throughout the day.
This data helps urban planners and researchers understand heat dynamics in cities.
Vegetation Health Assessment
While thermal imaging focuses on heat signatures, multi-spectral cameras take vegetation assessment to the next level. These specialized sensors capture light across various wavelengths, including visible and near-infrared spectrums.
You'll find that this technology allows drones to analyze plant health and stress levels with remarkable accuracy.
As you map urban heat islands, you'll use multi-spectral data to assess the relationship between vegetation and temperature. You can identify areas where plants are thriving or struggling, which directly impacts local temperatures.
The cameras detect chlorophyll levels, water content, and overall plant vigor, providing insights into the effectiveness of green spaces in cooling urban environments.
You'll analyze normalized difference vegetation index (NDVI) values to quantify plant health. Higher NDVI values indicate lush, healthy vegetation that's more effective at mitigating heat.
Lower values might reveal stressed plants or areas lacking sufficient greenery. This information helps you pinpoint where additional vegetation could make the most significant impact on reducing urban heat island effects.
LiDAR Technology Integration
You'll find LiDAR technology revolutionizing urban heat island mapping through its integration with drones.
It enables precise 3D terrain mapping, allowing you to visualize the cityscape's contours and their impact on heat distribution.
LiDAR also excels at evaluating vegetation density and analyzing building heat retention, giving you an all-encompassing understanding of factors influencing urban temperatures.
Precise 3D Terrain Mapping
LiDAR technology has revolutionized the way drones map urban heat islands. You'll find that this advanced sensing method allows for incredibly precise 3D terrain mapping, giving you a detailed view of the urban landscape.
As your drone flies over the city, it emits rapid laser pulses that bounce off surfaces and return to the sensor, measuring distances with remarkable accuracy.
With LiDAR-equipped drones, you're able to create high-resolution digital elevation models (DEMs) of the entire urban area. These models capture minute variations in surface height, including buildings, trees, and even small objects like cars.
You'll notice that the resulting 3D maps provide essential information about the city's topography, which directly influences heat distribution.
Vegetation Density Assessment
Building on the precise 3D terrain mapping capabilities, LiDAR technology also excels at evaluating vegetation density in urban areas. You'll find that drones equipped with LiDAR sensors can quickly scan large areas, creating detailed 3D point clouds of vegetation structures. These scans reveal essential information about tree canopy coverage, understory density, and overall green space distribution.
As you analyze the data, you'll notice how LiDAR distinguishes between different vegetation layers, allowing you to assess vertical stratification in urban forests. This information helps you identify areas lacking green cover, which often correlate with higher surface temperatures in heat islands.
You can use LiDAR-derived vegetation metrics to calculate leaf area index (LAI) and biomass estimates, providing valuable insights into the cooling potential of urban greenery. By integrating this data with thermal imaging, you'll create thorough maps that show the relationship between vegetation density and temperature variations across the city.
These detailed assessments enable urban planners to make informed decisions about where to prioritize tree planting and green infrastructure development to mitigate urban heat island effects effectively.
Building Heat Retention Analysis
With LiDAR technology, drones can now provide unprecedented insights into building heat retention patterns.
You'll find that these advanced sensors allow for precise 3D mapping of urban structures, capturing intricate details of building surfaces, materials, and geometries.
As you analyze the LiDAR data, you'll notice how different building materials absorb and retain heat.
Concrete and asphalt, for instance, tend to store more heat than lighter-colored or reflective surfaces. You can identify hotspots on rooftops, walls, and other structural elements, pinpointing areas that contribute most to the urban heat island effect.
The high-resolution data enables you to assess the thermal performance of individual buildings.
You'll detect heat leaks, poorly insulated areas, and inefficient HVAC systems. This information is essential for developing targeted strategies to improve energy efficiency and reduce heat retention.
High-Resolution Aerial Photography
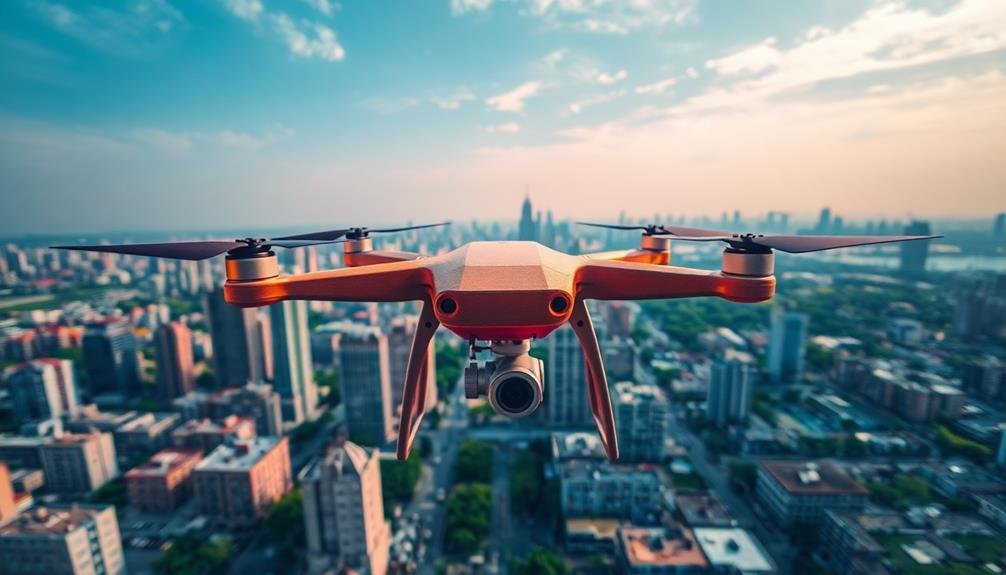
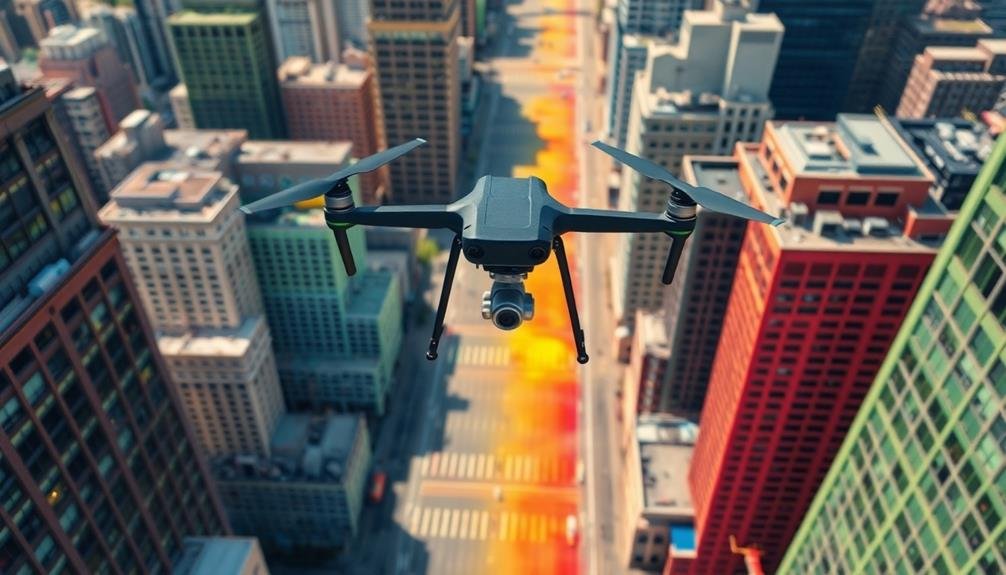
Drones have revolutionized the field of aerial photography, allowing researchers to capture high-resolution images of urban areas with unprecedented detail.
You'll find that these images provide valuable insights into the formation and distribution of urban heat islands. With drones, you're able to obtain clear, close-up views of various urban features that contribute to heat retention and reflection.
The high-resolution aerial photography captured by drones offers several advantages:
- Precision: You can identify specific heat-trapping materials on rooftops, roads, and other surfaces.
- Flexibility: You're able to capture images at different times of day to track heat patterns.
- Cost-effectiveness: You'll save money compared to traditional aircraft-based photography.
- Accessibility: You can easily photograph areas that are difficult to reach on foot or by vehicle.
3D Mapping Capabilities

You'll find that drones equipped with 3D mapping capabilities offer advanced insights into urban heat islands.
These devices can capture vertical temperature profiles, revealing how heat varies at different heights within the urban environment.
Additionally, you can use drones to map building heat signatures, identifying structures that contribute markedly to the urban heat island effect.
Vertical Temperature Profiling
As technology advances, drones are revolutionizing the way we map urban heat islands by offering vertical temperature profiling capabilities. You'll find that these unmanned aerial vehicles can collect data at various altitudes, providing a thorough 3D view of temperature variations within urban environments.
By equipping drones with specialized sensors, you're able to measure temperature, humidity, and air pressure at different heights. This vertical profiling allows you to:
- Identify temperature inversions
- Detect urban heat island intensity at various levels
- Analyze the impact of building heights on heat distribution
- Assess the effectiveness of green roofs and other cooling strategies
You'll appreciate how drones can quickly and efficiently gather data from ground level up to several hundred meters.
This vertical data collection gives you insights into how heat is trapped and dispersed within the urban canopy layer. You're able to pinpoint hot spots at different elevations and understand how heat interacts with various urban structures.
With this information, you can develop more targeted and effective strategies to mitigate urban heat island effects, improving the overall quality of life in cities.
Building Heat Signatures
Building heat signatures represent another powerful application of drone technology in urban heat island mapping. You'll find that drones equipped with thermal imaging cameras can capture detailed heat profiles of buildings across an urban landscape. These signatures reveal how different structures absorb, retain, and emit heat, providing valuable insights into energy efficiency and heat island contributions.
When you analyze building heat signatures, you'll uncover patterns related to construction materials, insulation quality, and overall thermal performance. This data helps urban planners and building owners identify areas for improvement and implement targeted solutions to reduce heat island effects.
Here's a quick overview of what building heat signatures can tell you:
| Information | Applications |
|---|---|
| Roof temperature | Energy efficiency assessment |
| Wall heat retention | Insulation improvement planning |
| Heat leakage points | Targeted retrofitting |
Real-Time Data Collection
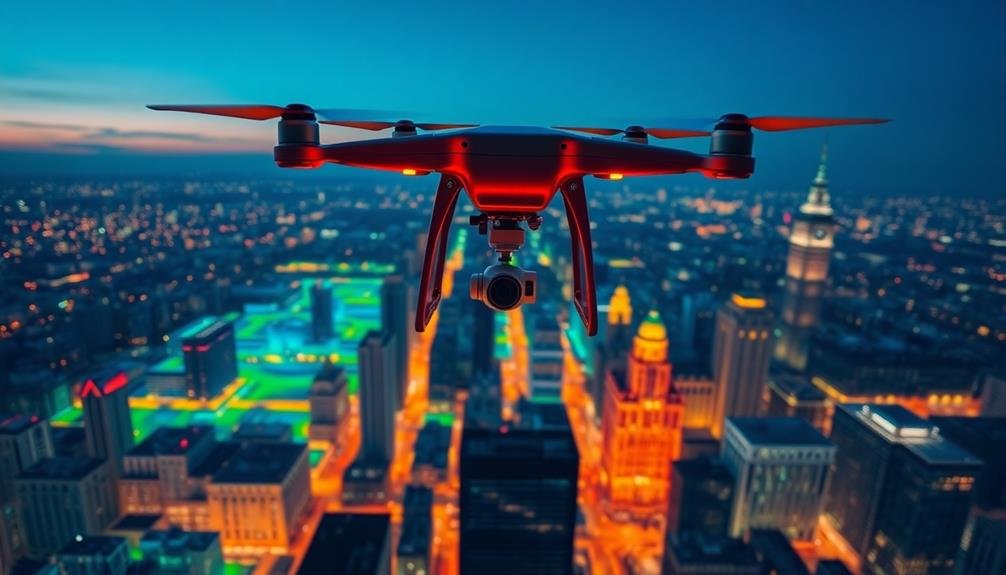
Through real-time data collection, drones offer unprecedented insights into urban heat island dynamics. You'll find that these unmanned aerial vehicles can gather temperature, humidity, and air quality data as they fly over cities. This real-time information allows researchers and urban planners to identify hot spots and track temperature changes throughout the day.
Drones equipped with thermal cameras and sensors can capture data at various altitudes, providing a thorough view of the urban heat landscape. You're able to see how heat patterns shift and evolve, which is essential for understanding the complex nature of urban heat islands.
This real-time data collection has several advantages:
- Immediate response to heat waves
- Accurate identification of cooling interventions' effectiveness
- Continuous monitoring of urban development impacts
- Enhanced predictive modeling for future climate scenarios
GPS-Enabled Precision Mapping
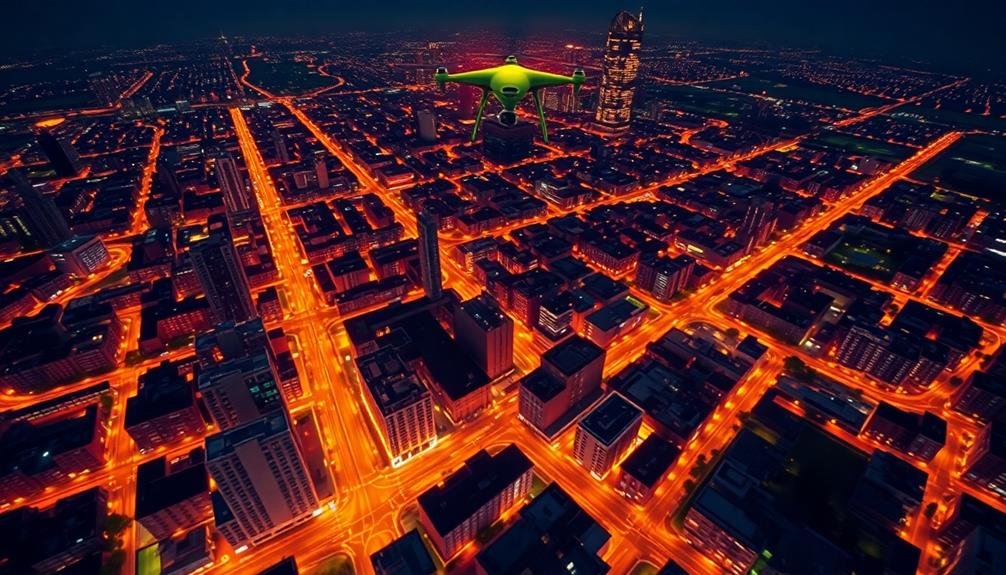
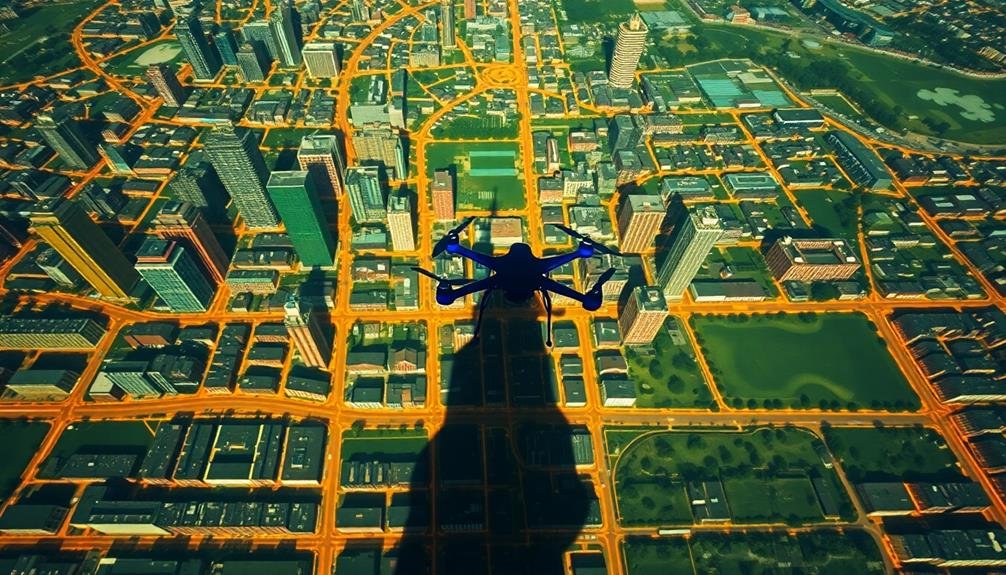
GPS-enabled precision mapping elevates drone-based urban heat island studies to new heights of accuracy. With this technology, you'll be able to pinpoint exact locations of heat anomalies within cities.
Drones equipped with GPS receivers can create highly detailed maps, correlating temperature data with specific geographical coordinates. You'll find that this precision allows for the identification of micro-heat islands, such as individual buildings or small urban spaces that contribute disproportionately to the overall heat island effect.
The GPS data enables you to overlay temperature information onto existing city maps, creating extensive heat distribution models. When you're analyzing the data, you can easily track changes over time by comparing GPS-tagged temperature readings from different dates.
This temporal aspect is vital for understanding how urban development impacts heat island formation. Additionally, GPS precision helps you identify cooler areas within cities, which can inform urban planning decisions for heat mitigation strategies.
Automated Flight Patterns
Numerous drones now utilize automated flight patterns to enhance the efficiency and consistency of urban heat island mapping. You'll find that these pre-programmed flight paths allow drones to cover large areas systematically, ensuring thorough data collection. They're designed to maintain ideal altitude and speed for accurate temperature readings, adapting to various urban landscapes.
When you're using automated flight patterns, you're benefiting from:
- Repeatability: Drones can follow the same path multiple times, enabling consistent data comparison over time.
- Obstacle avoidance: Advanced algorithms help drones navigate around buildings and other structures safely.
- Energy efficiency: Streamlined routes minimize battery consumption, extending flight time.
- Minimal human intervention: Once programmed, drones can operate with little to no manual control.
You'll appreciate how these automated patterns can be customized to focus on specific areas of interest, such as known hot spots or newly developed neighborhoods.
They're also adaptable to different times of day, allowing you to capture temperature variations throughout the diurnal cycle. By leveraging automated flight patterns, you're able to gather more thorough and accurate data on urban heat islands, leading to better-informed urban planning and climate mitigation strategies.
Machine Learning Analysis
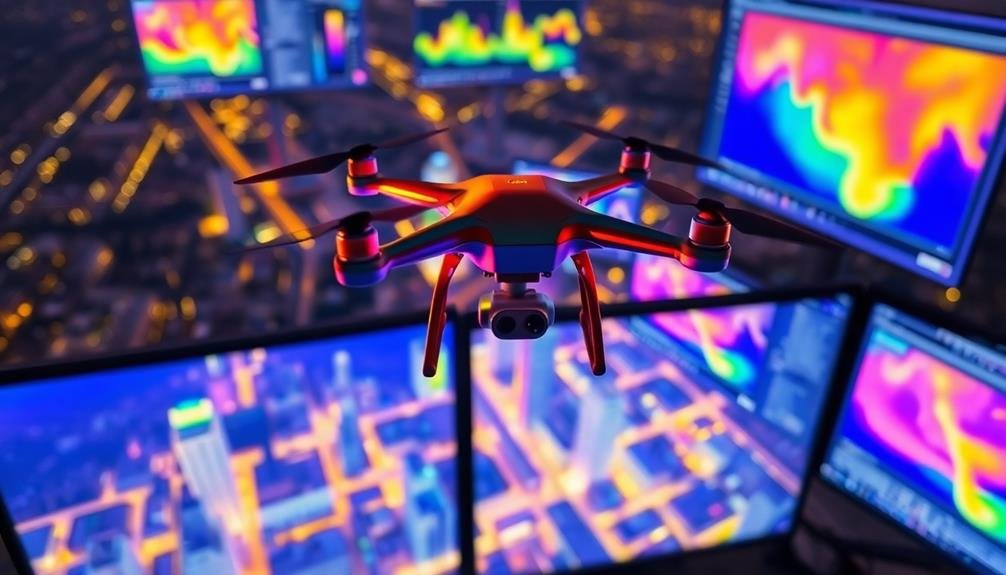
As drones collect vast amounts of temperature data, machine learning algorithms step in to process and analyze this information efficiently. You'll find that these algorithms can quickly identify patterns and anomalies in the data, helping to pinpoint urban heat islands with remarkable accuracy.
Machine learning models can be trained to recognize specific heat signatures associated with different urban features. You're able to use these models to classify areas based on their thermal properties, such as distinguishing between heat-absorbing asphalt and cooler green spaces. This classification helps you understand the composition of urban heat islands and their contributing factors.
You'll also benefit from predictive modeling capabilities. By analyzing historical data and current conditions, machine learning algorithms can forecast how urban heat islands might evolve over time. This foresight allows you to plan mitigation strategies more effectively.
Furthermore, you can use machine learning to correlate temperature data with other urban metrics, such as population density or energy consumption. These insights help you identify relationships between urban development and heat island formation, guiding future urban planning decisions to create cooler, more sustainable cities.
Time-Series Heat Mapping
While single snapshots of urban heat provide valuable insights, time-series heat mapping offers a dynamic view of temperature changes throughout the day and across seasons.
You'll gain a deeper understanding of how urban heat islands evolve over time, allowing for more targeted interventions and urban planning strategies.
Time-series heat mapping with drones involves repeated flights over the same area at different times. You'll capture thermal data that shows how heat accumulates and dissipates in various urban environments.
This approach reveals:
- Diurnal temperature variations
- Seasonal heat patterns
- Impact of weather events on urban heat
- Long-term trends in heat island intensity
Frequently Asked Questions
How Do Urban Heat Islands Impact Public Health and Energy Consumption?
You'll face increased health risks in urban heat islands, like heat exhaustion and respiratory issues. They'll also drive up your energy bills as you crank up the AC, contributing to higher electricity consumption and greenhouse gas emissions.
What Regulations Govern the Use of Drones for Urban Heat Mapping?
You'll need to follow FAA regulations for commercial drone use, including pilot certification and flight restrictions. Local laws may also apply. Obtain necessary permits and respect privacy concerns when conducting urban heat mapping missions with drones.
How Often Should Heat Island Mapping Be Conducted for Accurate Trend Analysis?
You'll want to conduct heat island mapping annually for reliable trend analysis. However, if you're tracking rapid changes or specific interventions, you might need to map more frequently, such as seasonally or quarterly, for accurate results.
Can Drones Detect Specific Heat-Contributing Factors Like Building Materials or Traffic Patterns?
Yes, drones can detect specific heat contributors. They'll capture thermal imagery of building materials and traffic patterns. You'll see how different surfaces absorb and emit heat, helping identify key factors in urban heat islands.
How Do Weather Conditions Affect the Accuracy of Drone-Based Heat Island Mapping?
You'll find that weather conditions greatly impact drone heat mapping accuracy. Wind can disrupt flight paths, while cloud cover affects thermal readings. Humidity alters heat signatures, and precipitation interferes with sensors. It's best to map on clear, calm days.
In Summary
You've seen how drones revolutionize urban heat island mapping. They're not just flying cameras; they're high-tech tools equipped with thermal sensors, multi-spectral imaging, and LiDAR. They'll give you precise, 3D maps of heat distribution in cities. With automated flights and machine learning analysis, you're getting more accurate data than ever before. Don't underestimate the power of these aerial mappers – they're changing how we comprehend and address urban heat challenges.
As educators and advocates for responsible drone use, we’re committed to sharing our knowledge and expertise with aspiring aerial photographers.
Leave a Reply