To effectively track urban sprawl growth, you'll want to employ these three powerful methods: aerial imagery analysis, GIS mapping techniques, and machine learning algorithms. Aerial imagery analysis uses high-resolution images to measure built-up areas over time. GIS mapping integrates various data sources to create detailed, layered maps for visualizing urban expansion. Machine learning algorithms revolutionize data processing, enabling efficient classification of land use types and prediction of future growth patterns. These methods work in tandem to provide extensive insights into urban development trends, allowing city planners and researchers to make informed decisions. Explore further to access the full potential of these cutting-edge techniques in urban analysis.
Aerial Imagery Analysis
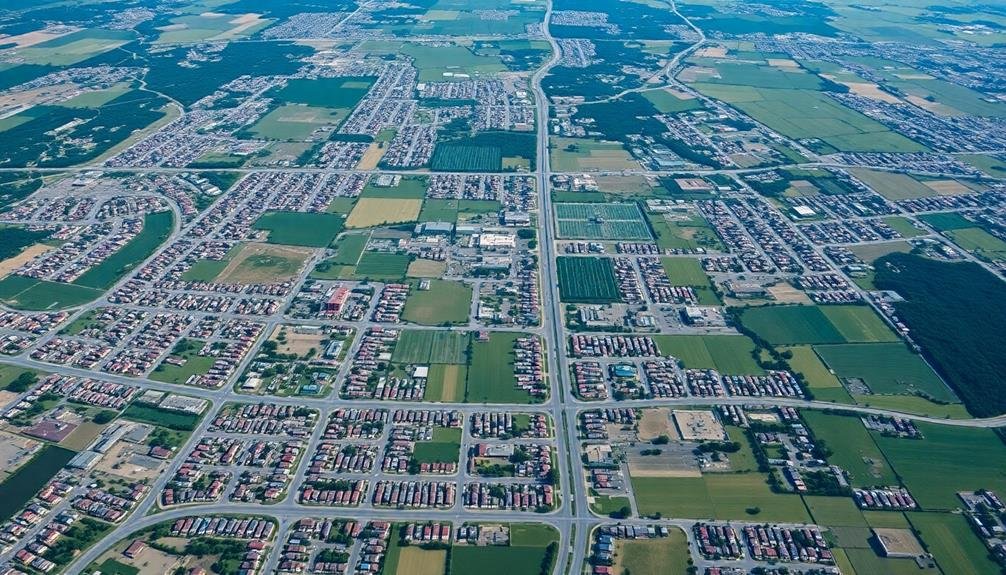
One of the most effective methods for tracking urban sprawl growth is aerial imagery analysis. You'll find this technique invaluable for monitoring urban expansion over time. By comparing aerial photographs or satellite images taken at different intervals, you can visualize and quantify changes in land use patterns.
To get started, you'll need to acquire high-resolution images of your study area from various time periods. These can be obtained from government agencies, commercial satellite providers, or historical archives.
Once you've gathered your imagery, you'll use Geographic Information System (GIS) software to analyze the data. You'll overlay the images and digitize urban boundaries for each time period. This process allows you to measure the increase in built-up areas, identify new development zones, and calculate the rate of urban expansion.
You can also detect changes in vegetation cover, road networks, and other land use categories. Advanced techniques like object-based image analysis and machine learning algorithms can automate much of this process, enabling you to analyze larger areas more efficiently.
GIS Mapping Techniques
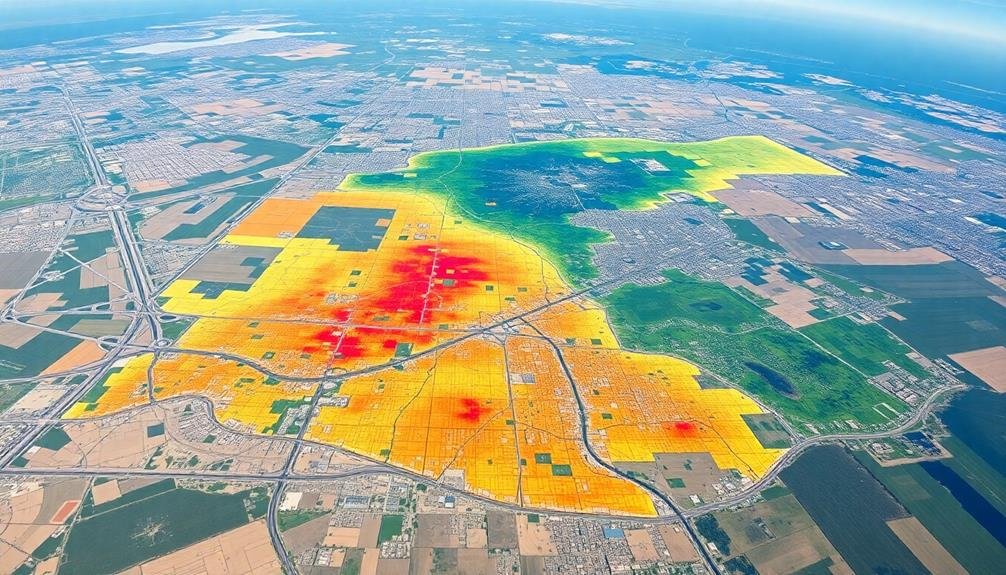
Geographic Information System (GIS) mapping techniques form the backbone of urban sprawl analysis. You'll find that GIS tools allow you to create detailed, layered maps that showcase the expansion of urban areas over time. By integrating various data sources, including satellite imagery, census data, and land use records, you can visualize and quantify urban growth patterns.
To effectively use GIS for tracking urban sprawl, you'll want to follow these key steps:
- Collect and organize your spatial data from multiple sources
- Create base maps of your study area for different time periods
- Overlay various data layers to identify changes in land use and development
- Perform spatial analysis to calculate growth rates and patterns
You'll find that GIS software offers powerful tools for measuring urban sprawl indicators, such as land consumption rates, population density changes, and infrastructure expansion.
Machine Learning Algorithms
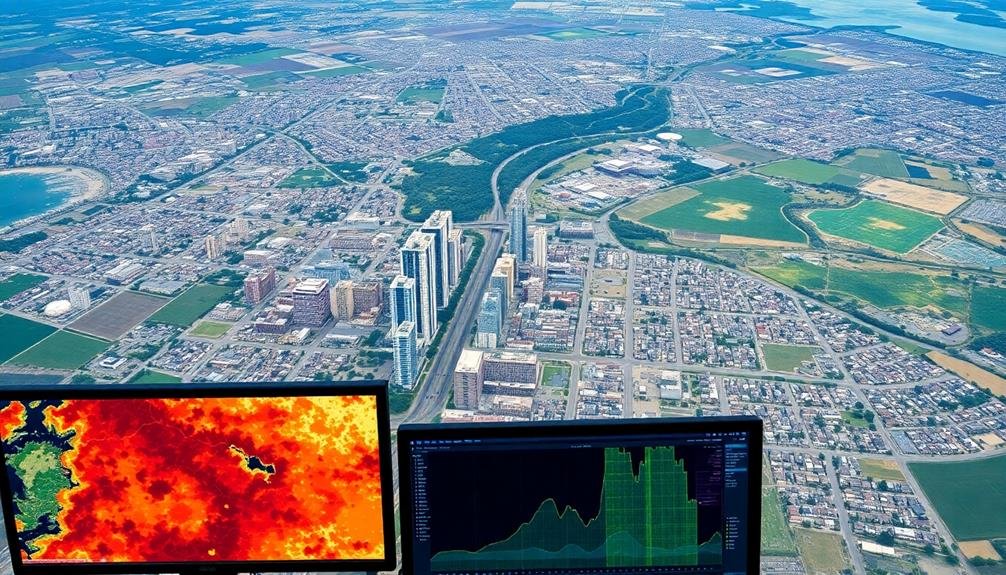
While GIS mapping techniques provide a solid foundation for urban sprawl analysis, machine learning algorithms are revolutionizing how we process and interpret this data. You'll find that these algorithms can quickly analyze vast amounts of spatial and temporal information, identifying patterns and trends that might be missed by human observers.
You can use supervised learning algorithms to classify land use types based on satellite imagery, helping you track changes in urban areas over time. Unsupervised learning algorithms can detect clusters and anomalies in urban growth patterns, revealing unexpected developments or potential areas of concern.
Deep learning models, such as convolutional neural networks, are particularly effective for image recognition tasks. You'll be able to use these to automatically detect and measure urban features like buildings, roads, and green spaces from high-resolution satellite images.
Machine learning also enables you to create predictive models of urban sprawl. By training algorithms on historical data, you can forecast future growth patterns and assess the potential impact of different urban planning scenarios. This predictive capability is invaluable for policymakers and urban planners seeking to manage sustainable urban development.
Frequently Asked Questions
How Do Socioeconomic Factors Influence the Rate of Urban Sprawl?
You'll find that higher incomes, population growth, and cheaper land prices accelerate urban sprawl. Job opportunities and improved transportation also drive expansion. Conversely, economic downturns, aging populations, and strict land-use policies can slow sprawl's pace.
What Are the Environmental Impacts of Unchecked Urban Expansion?
You'll see devastating environmental impacts from unchecked urban expansion. It'll destroy habitats, increase pollution, and deplete natural resources. You're looking at more flooding, higher temperatures, and reduced biodiversity as cities sprawl uncontrollably into surrounding areas.
How Can Urban Planners Use Sprawl Tracking Data to Improve City Design?
You can use sprawl tracking data to identify growth patterns and optimize land use. You'll pinpoint areas for infill development, plan efficient transportation networks, and preserve green spaces. This data helps you create more sustainable, livable cities.
What Role Does Public Policy Play in Managing Urban Sprawl Growth?
You'll find that public policy plays an essential role in managing urban sprawl. It can shape zoning laws, incentivize dense development, limit expansion, and promote sustainable growth. Policymakers' decisions directly impact how cities spread and develop.
How Does Urban Sprawl Affect Transportation Infrastructure and Traffic Patterns?
You'll notice urban sprawl increases car dependency, extending commute times. It strains existing roads, necessitating new infrastructure. You'll see more traffic congestion, as public transit becomes less effective. It's a cycle that perpetuates car-centric development.
In Summary
You've now explored three powerful methods for tracking urban sprawl growth: aerial imagery analysis, GIS mapping techniques, and machine learning algorithms. Each approach offers unique insights into urban expansion patterns. By combining these methods, you'll gain an extensive understanding of how cities are evolving. Remember, staying informed about urban growth is vital for effective city planning and sustainable development. Keep these tools in mind as you tackle the challenges of monitoring and managing urban sprawl in your area.
As educators and advocates for responsible drone use, we’re committed to sharing our knowledge and expertise with aspiring aerial photographers.


Leave a Reply