
Aerial detection techniques have revolutionized the way you can spot and track invasive species across vast landscapes. You'll use visual identification through high-resolution imagery, multispectral analysis to reveal hidden patterns, and thermal sensing to locate warm-blooded invaders. LiDAR mapping provides detailed 3D vegetation models, while hyperspectral data interpretation offers precise species identification. Ground truthing guarantees accuracy, and you'll create distribution maps to visualize the spread. Integrating these methods with pest management approaches allows for effective control strategies. By mastering these techniques, you'll stay ahead in the fight against invasive species and uncover the secrets of successful detection from above.
Visual Identification Techniques

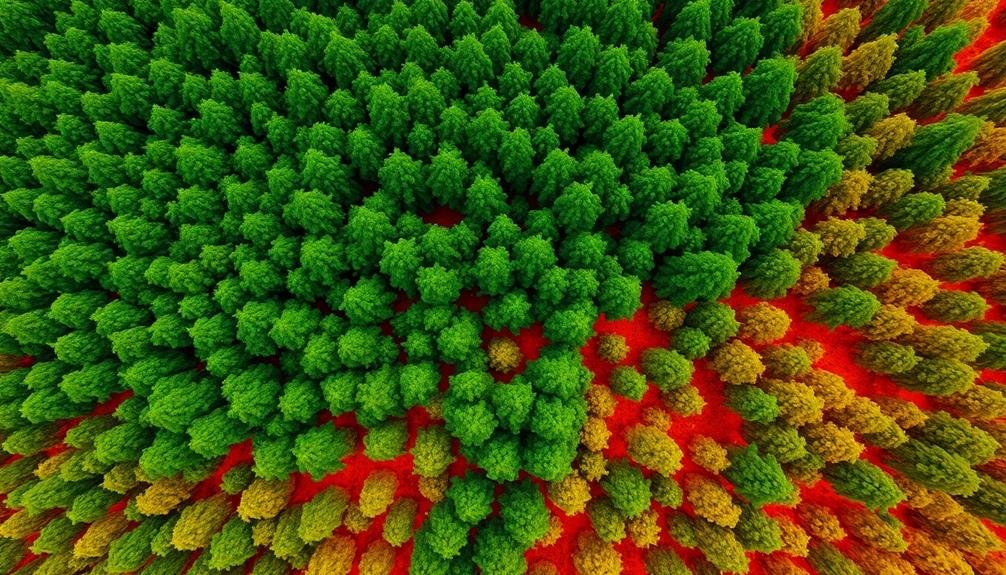
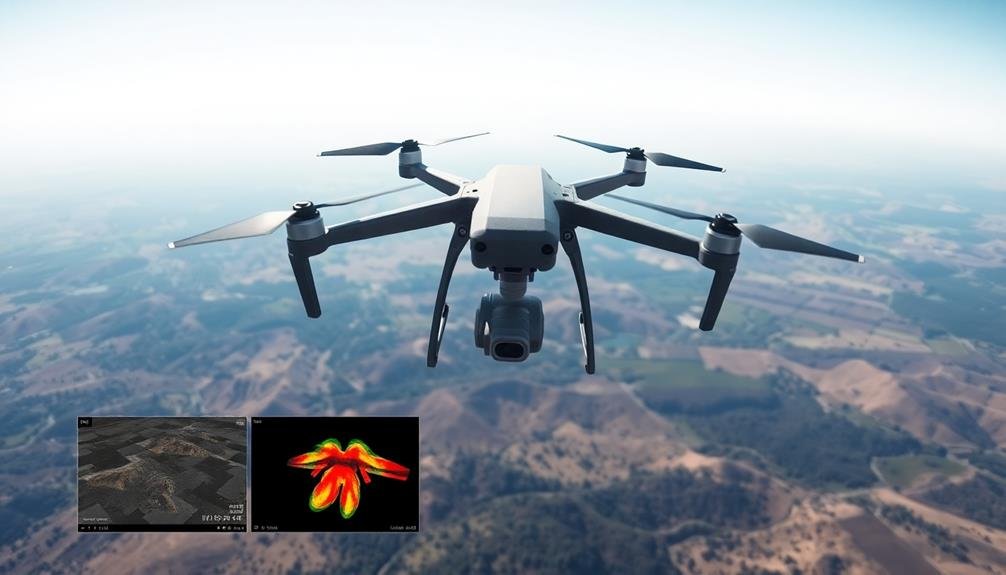
When it comes to detection techniques, visual identification is often our first line of defense. You'll find that aerial imagery plays an essential role in spotting invasive species from above. High-resolution satellite images and drone footage can reveal patterns and anomalies in vegetation that aren't visible from the ground.
You should look for changes in color, texture, and density of plant cover. Invasive species often form dense monocultures, creating uniform patches that stand out from native plant communities. Pay attention to seasonal changes, as some invaders may leaf out earlier or retain foliage longer than native species.
Multispectral and hyperspectral imaging can detect subtle differences in plant reflectance, helping you identify specific species. These technologies can highlight stress in native plants caused by invasive competitors.
You'll also want to use thermal imaging to spot differences in transpiration rates between native and invasive plants.
Remember to combine visual data with ground truthing for accurate identification. Train your eye to recognize key features of target species, such as distinctive leaf shapes or growth patterns.
Regular monitoring and comparison of images over time will help you detect new invasions early.
Multispectral Imaging Analysis

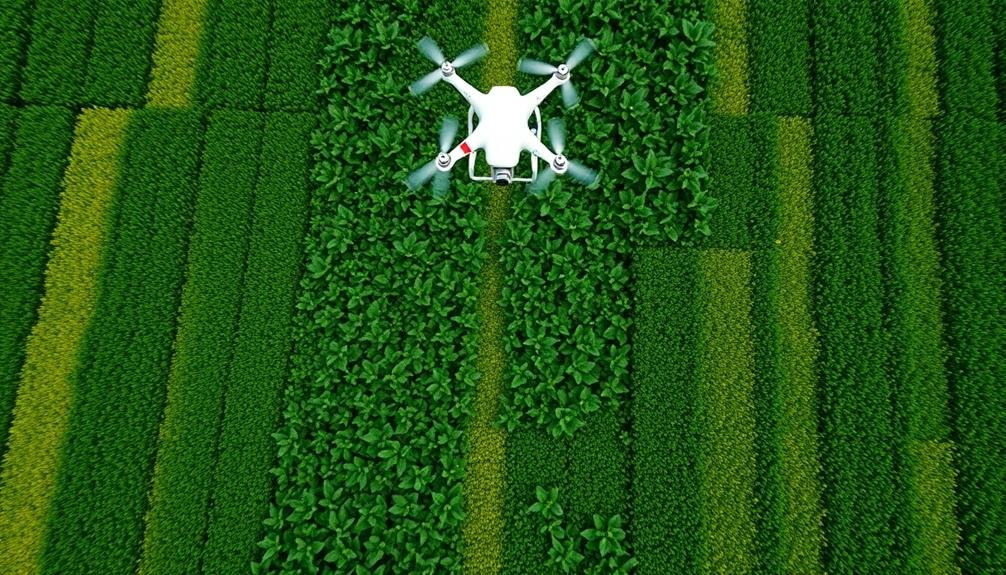
Researchers have revolutionized invasive species detection with multispectral imaging analysis. This technique allows you to capture images across multiple wavelengths of light, including those invisible to the human eye. By analyzing these spectral signatures, you can identify invasive plants and animals that might otherwise blend in with their surroundings.
You'll find that multispectral imaging is particularly effective when used with drone or satellite technology. It can cover large areas quickly, making it ideal for monitoring vast ecosystems. The process involves collecting data from various light spectrums, such as visible light, near-infrared, and thermal infrared. Each species has a unique spectral signature, which you can use to distinguish it from native flora and fauna.
To use this method, you'll need specialized cameras and image processing software. Once you've collected the data, you'll analyze it using algorithms that can detect subtle differences in spectral reflectance. This allows you to create detailed maps of invasive species distributions, even in hard-to-reach areas.
You can also track changes over time, helping you to assess the effectiveness of control measures and predict future spread patterns.
Thermal Sensing Applications
Thermal sensing offers another powerful tool in the arsenal of invasive species detection techniques. You'll find it particularly useful for identifying warm-blooded animals in dense vegetation or during nighttime surveys. This technology detects heat signatures emitted by living organisms, allowing you to spot invaders that might otherwise remain hidden.
When you're using thermal sensors, you'll be able to differentiate between species based on their unique thermal profiles. For example, you can distinguish between native and invasive mammals by analyzing their body heat patterns.
You'll also find thermal sensing invaluable for locating nests or burrows of invasive species, as these often have distinct temperature signatures compared to their surroundings.
You can employ thermal sensing in various ways, including handheld devices for ground surveys or mounted on drones for aerial reconnaissance. It's especially effective when combined with other detection methods like visual imaging or acoustic monitoring.
LiDAR Mapping for Vegetation
You'll find LiDAR technology invaluable for mapping vegetation, as it provides detailed 3D representations of plant structures.
With LiDAR, you can analyze canopy structure, measuring height, density, and layering of forest ecosystems.
Advanced LiDAR techniques even allow you to identify specific plant species based on their unique structural characteristics and reflectance properties.
Lidar Basics for Vegetation
LiDAR technology has revolutionized vegetation mapping, offering unprecedented detail and accuracy in evaluating forest structure and biomass. When you're using LiDAR for vegetation analysis, you'll need to understand its basic principles. LiDAR sensors emit laser pulses that bounce off objects and return to the sensor, measuring the time it takes for the light to return. This data creates a 3D point cloud of the scanned area.
For vegetation mapping, you'll focus on the following key aspects:
| LiDAR Aspect | Vegetation Application |
|---|---|
| Canopy height | Estimate tree heights |
| Vertical structure | Analyze forest layers |
| Density | Assess biomass |
| Penetration | Detect understory |
| Return intensity | Identify species |
You'll find that LiDAR can penetrate forest canopies, providing information about understory vegetation and ground topography. It's particularly useful for detecting changes in vegetation over time, making it invaluable for monitoring invasive species spread. When analyzing LiDAR data, you'll use specialized software to classify points and extract relevant information about vegetation structure, density, and distribution. This data can then be used to create detailed 3D models and maps of forest ecosystems.
Canopy Structure Analysis
Canopy structure analysis is a key application of LiDAR in vegetation mapping. It allows you to create detailed 3D models of forest canopies, providing insights into tree height, density, and overall forest structure. You'll use LiDAR pulses to penetrate the canopy layers, capturing data on both the top of the canopy and the underlying vegetation.
When analyzing canopy structure, you'll focus on several significant metrics. Canopy height models (CHMs) give you a clear picture of the tallest trees in an area. You can also measure canopy cover, which indicates the percentage of ground covered by vegetation when viewed from above.
Leaf area index (LAI) estimates the total leaf surface area per unit of ground area, essential for understanding forest productivity. LiDAR data allows you to identify gaps in the canopy, which can be important for understanding forest dynamics and wildlife habitat.
You'll also be able to assess vertical structure complexity, revealing the distribution of vegetation at different heights. This information is valuable for biodiversity assessments and understanding forest health. By comparing LiDAR data over time, you can track changes in canopy structure, monitoring forest growth or decline.
Species Identification Techniques
How can LiDAR technology help in identifying different plant species? LiDAR's high-resolution 3D mapping capabilities allow you to analyze vegetation structure and characteristics with unprecedented detail. You'll be able to differentiate species based on their unique structural properties, such as height, crown shape, and branching patterns.
To use LiDAR for species identification, you'll need to:
- Collect high-density LiDAR data
- Process and classify point clouds
- Extract relevant features
- Apply machine learning algorithms
Here's a breakdown of key LiDAR features for species identification:
| Feature | Description |
|---|---|
| Height | Maximum and average tree heights |
| Crown shape | Width, depth, and overall geometry |
| Branching | Angle, density, and distribution |
| Leaf area | Estimated foliage density and distribution |
Hyperspectral Data Interpretation

You'll find hyperspectral data interpretation to be a powerful tool for vegetation analysis.
Through spectral signature analysis, you can identify unique plant species and their characteristics, while dimensionality reduction techniques help manage the vast amount of data collected.
Spectral Signature Analysis
Spectral signature analysis frequently plays an important role in interpreting hyperspectral data for detection purposes. This technique allows you to identify specific materials or objects based on their unique spectral characteristics.
When you're analyzing hyperspectral imagery, you'll focus on the distinct patterns of light absorption and reflection across various wavelengths.
To perform spectral signature analysis, you'll first need a spectral library containing known signatures of target materials. You'll then compare the spectral signatures in your imagery to these reference spectra. This process helps you detect and classify objects of interest, such as invasive plant species or specific minerals.
You'll often use software tools to automate this comparison process, applying algorithms like Spectral Angle Mapper (SAM) or Spectral Information Divergence (SID). These tools can help you identify matches and quantify the similarity between observed and reference spectra.
It's vital to evaluate factors that can affect spectral signatures, such as atmospheric conditions, sensor calibration, and viewing geometry. You'll need to apply appropriate corrections to guarantee accurate analysis.
Dimensionality Reduction Techniques
While spectral signature analysis is powerful, the high dimensionality of hyperspectral data can pose challenges. You'll find that dimensionality reduction techniques are essential for managing this complexity. These methods help you extract the most relevant information from your data while reducing computational demands.
Principal Component Analysis (PCA) is a popular technique you can use. It transforms your data into a new coordinate system, where the first few components capture most of the variance. This allows you to focus on the most informative aspects of your data.
Another method you'll find useful is Independent Component Analysis (ICA). It separates mixed signals into their independent sources, which can be particularly helpful when dealing with mixed pixels in your hyperspectral images.
You might also consider using t-SNE (t-distributed Stochastic Neighbor Embedding) for visualizing high-dimensional data in a lower-dimensional space. This technique preserves local relationships between data points, making it easier to identify clusters and patterns.
Vegetation Stress Indicators
Interpreting hyperspectral data to identify vegetation stress indicators is a critical skill in remote sensing. You'll need to analyze the spectral signatures of plants to detect subtle changes in their health. Look for shifts in the red edge, which is the sharp increase in reflectance between visible and near-infrared wavelengths. Stressed vegetation often shows a less pronounced red edge.
Pay attention to specific absorption features. Chlorophyll content, a key indicator of plant health, can be assessed by examining absorption in the visible spectrum, particularly in the red and blue regions. Water stress is often reflected in the near-infrared and shortwave infrared bands.
You can use vegetation indices like the Normalized Difference Vegetation Index (NDVI) or more advanced indices tailored for specific stressors. These indices help quantify plant vigor and can reveal patterns of stress across landscapes.
Don't forget to take into account temporal changes. Comparing hyperspectral data over time can reveal progressive stress or recovery.
You'll also need to account for natural seasonal variations to avoid false positives. By mastering these techniques, you'll be well-equipped to detect early signs of vegetation stress and potential invasive species impacts.
Machine Learning in Species Detection
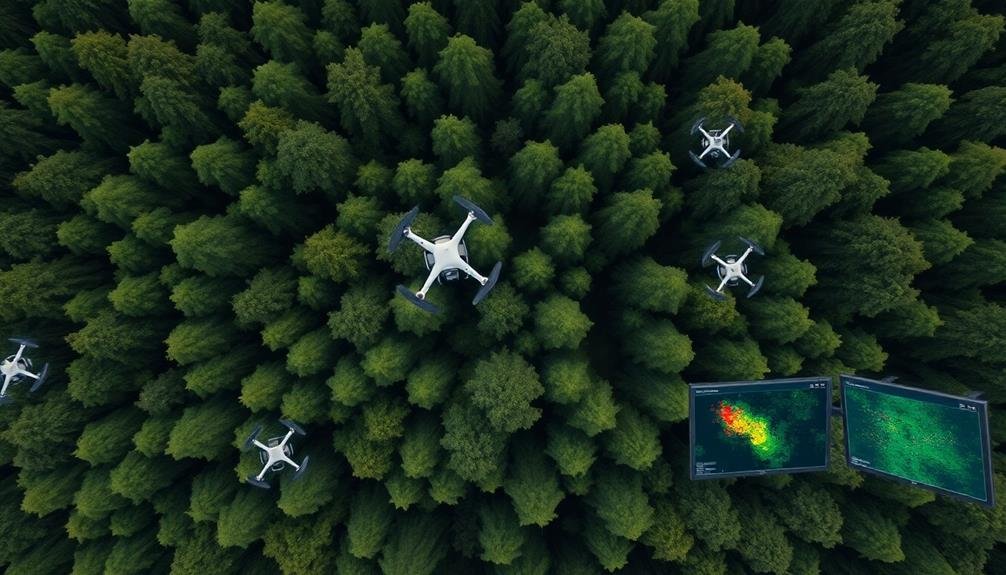
Machine learning has revolutionized species detection, offering powerful tools to identify and classify organisms with unprecedented accuracy and speed. You'll find that these algorithms can process vast amounts of data from various sources, including satellite imagery, drone footage, and ground-based sensors.
By training models on extensive datasets of known species, you can create systems that recognize unique patterns and features associated with invasive plants or animals.
When you're implementing machine learning for species detection, you'll often use convolutional neural networks (CNNs) for image analysis. These networks excel at identifying visual patterns and can distinguish between native and invasive species based on subtle differences in leaf shape, color, or texture.
You can also employ recurrent neural networks (RNNs) to analyze time-series data, helping you detect changes in vegetation cover or animal movement patterns over time.
To improve your detection accuracy, you'll want to combine multiple data sources and machine learning techniques. For example, you can integrate spectral analysis with object detection algorithms to identify specific plant species within complex ecosystems.
Automated Image Processing Systems

Automated image processing systems revolutionize species detection through advanced machine learning algorithms.
You'll find these systems capable of analyzing vast datasets in real-time, identifying and classifying species with remarkable accuracy.
Machine Learning Algorithms
Over the past decade, the field of detection has been revolutionized by machine learning algorithms, particularly in automated image processing systems. These algorithms have greatly enhanced our ability to spot invaders from above, offering unprecedented accuracy and efficiency.
You'll find that machine learning models, such as convolutional neural networks (CNNs), are particularly effective for image analysis. They can be trained on vast datasets of aerial imagery to recognize patterns, shapes, and textures associated with invasive species or human-made structures. As you implement these algorithms, you'll notice they can quickly process thousands of images, identifying potential invaders with remarkable precision.
Another advantage you'll discover is the adaptability of machine learning algorithms. They can be fine-tuned to detect specific types of invaders or adjust to different environmental conditions. You can also combine multiple algorithms to create ensemble models, further improving detection accuracy.
However, you should be aware that these algorithms require substantial computing power and high-quality training data. It's essential to regularly update and refine your models to maintain their effectiveness as new invaders emerge or environmental conditions change.
Real-Time Data Analysis
Building on the power of machine learning algorithms, real-time data analysis takes detection to the next level. These systems process and analyze aerial imagery as it's captured, providing instant results and enabling rapid response to potential threats.
You'll find that real-time data analysis systems use sophisticated image processing techniques to identify and classify objects of interest. They can detect changes in the landscape, spot unusual patterns, and flag potential invasive species within seconds of image acquisition. This speed is essential for early intervention and effective management of invasive species.
These systems often employ edge computing, where data is processed on-board the aerial vehicle or at nearby ground stations. This approach reduces latency and allows for immediate decision-making in the field.
You'll also benefit from the ability to integrate multiple data sources, such as thermal imaging, multispectral sensors, and GPS data, for a more thorough analysis.
Real-time data analysis systems can automatically alert you to areas of concern, prioritize regions for further investigation, and even suggest ideal flight paths for more detailed surveys. By leveraging these advanced technologies, you'll greatly enhance your ability to detect and respond to invasive species threats quickly and efficiently.
Seasonal Monitoring Strategies
Changing seasons bring unique challenges for detection systems. You'll need to adapt your monitoring strategies to account for varying environmental conditions throughout the year.
In spring and summer, focus on increased vegetation growth that can obscure ground-based targets. Use infrared sensors to detect heat signatures beneath dense foliage.
During fall, pay attention to color changes in vegetation that might reveal previously hidden objects or patterns.
Winter presents its own set of challenges. Snow cover can alter landscapes dramatically, making it vital to employ multispectral imaging to detect anomalies beneath the snow.
You'll also need to adjust for shorter daylight hours by incorporating night vision and thermal imaging technologies.
Throughout the year, maintain a consistent monitoring schedule, but be prepared to increase frequency during significant periods like migration seasons or known peak activity times for specific invaders.
Don't forget to calibrate your equipment for temperature fluctuations and varying humidity levels.
Drone Flight Planning Essentials
When planning your drone flights for detection purposes, you'll need to focus on three key areas.
First, optimize your flight path to maximize coverage while minimizing time and energy expenditure.
Second, carefully consider weather conditions and terrain obstacles that could impact your drone's performance and safety.
Flight Path Optimization
Effective flight path optimization is a crucial element of drone flight planning. You'll need to take into account several factors to create the most efficient route for your drone. Start by identifying your survey area and its boundaries.
Then, determine the ideal altitude for your mission, balancing coverage area with image resolution requirements. Think about the drone's battery life and plan your route to maximize flight time while guaranteeing complete coverage.
Factor in potential obstacles, such as tall structures or restricted airspace, and adjust your path accordingly. Utilize grid or lawn-mower patterns for systematic coverage, adapting the flight lines to the shape of your survey area.
Take advantage of waypoint planning software to automate your flight path. These tools can help you calculate the most efficient route based on your drone's capabilities and mission requirements.
Don't forget to account for weather conditions, particularly wind direction and speed, which can affect your drone's performance and battery life. Lastly, include buffer zones around your survey area to guarantee complete coverage and plan for multiple flights if necessary.
Weather and Terrain Considerations
Two critical factors in drone flight planning are weather conditions and terrain features. When planning your drone flights for detection purposes, you'll need to carefully consider both elements to guarantee successful missions.
Weather conditions greatly impact your drone's performance and data collection. Wind speed and direction affect flight stability and battery life. You'll want to avoid flying in strong winds, rain, or extreme temperatures. Check local weather forecasts and plan your flights during ideal conditions.
Remember that weather can change rapidly, so always monitor conditions throughout your mission.
Terrain features pose unique challenges and opportunities for drone detection. Mountainous areas may offer vantage points but can create turbulence and limit line-of-sight communications. Dense forests can obstruct views but provide cover for your operations.
Coastal areas may have strong winds and salt spray that can damage equipment. You'll need to adapt your flight plans based on the specific terrain you're operating in.
To enhance your detection capabilities, combine weather and terrain knowledge. Use elevation data to plan flight paths that maximize coverage while minimizing risks.
Consider seasonal changes in vegetation and how they might affect visibility. By carefully evaluating these factors, you'll improve your drone's effectiveness in spotting invaders from above.
Battery Life Management
Battery life management stands as a cornerstone of successful drone flight planning. You'll need to carefully consider your drone's power capacity and enhance its usage to maximize flight time. Start by fully charging your batteries before each mission and carrying spares for longer operations.
Monitor your battery levels constantly during flight, setting up alerts to warn you when power drops below critical thresholds. To extend battery life, minimize unnecessary power consumption. Reduce the use of high-drain features like cameras or sensors when they're not needed.
Flying in calm weather conditions and at a steady pace can also help conserve energy. Plan your flight path efficiently, avoiding unnecessary detours or altitude changes that could drain power quickly.
Temperature affects battery performance, so protect your batteries from extreme heat or cold. In colder climates, consider using battery warmers to maintain peak operating temperatures.
Always land your drone with a safe power reserve, typically around 20-30% of battery capacity. This buffer guarantees you have enough power for unexpected situations or emergency maneuvers.
Data Collection and Management

Data collection and management form the foundation of successful detection techniques. When using drones for spotting invaders, you'll need to gather and organize vast amounts of information effectively. Start by determining what data you need to collect, such as visual imagery, thermal readings, or GPS coordinates.
Make certain your drone is equipped with the right sensors and cameras to capture this information accurately. As you collect data, you'll need a robust system to store and manage it. Consider using cloud-based storage solutions that offer secure, scalable options for handling large datasets.
Implement a clear naming convention and folder structure to keep your files organized and easily accessible. Data processing is essential for extracting valuable insights. Use specialized software to analyze imagery, detect patterns, and identify potential invaders.
Implement machine learning algorithms to improve detection accuracy over time. Don't forget about data security. Encrypt sensitive information and limit access to authorized personnel only.
Regularly back up your data to prevent loss in case of hardware failure or cyber attacks.
Ground Truthing Methodologies
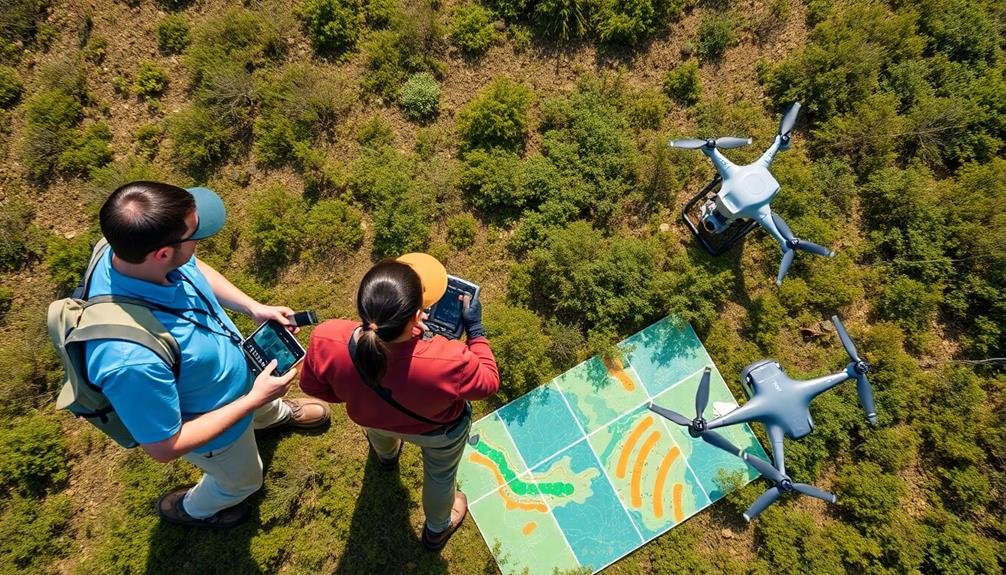
Accuracy lies at the heart of ground truthing methodologies, which are essential for validating the data collected by drones. You'll need to compare aerial imagery with on-site observations to guarantee the reliability of your detection techniques. Start by selecting representative sample areas within your survey region, covering various terrain types and vegetation densities.
When conducting ground truthing, you'll:
- Visit selected sites
- Record precise GPS coordinates
- Document observed invasive species
- Note vegetation characteristics
- Take high-resolution photos
Use this data to create a robust reference dataset for comparing with drone-captured imagery. Here's a breakdown of common ground truthing methods:
| Method | Pros | Cons |
|---|---|---|
| Transect walks | Systematic coverage | Time-consuming |
| Quadrat sampling | Detailed data collection | Limited area covered |
| Point-intercept | Quick and efficient | May miss rare species |
| Visual estimation | Rapid assessment | Subjective results |
| GPS mapping | Precise location data | Equipment-dependent |
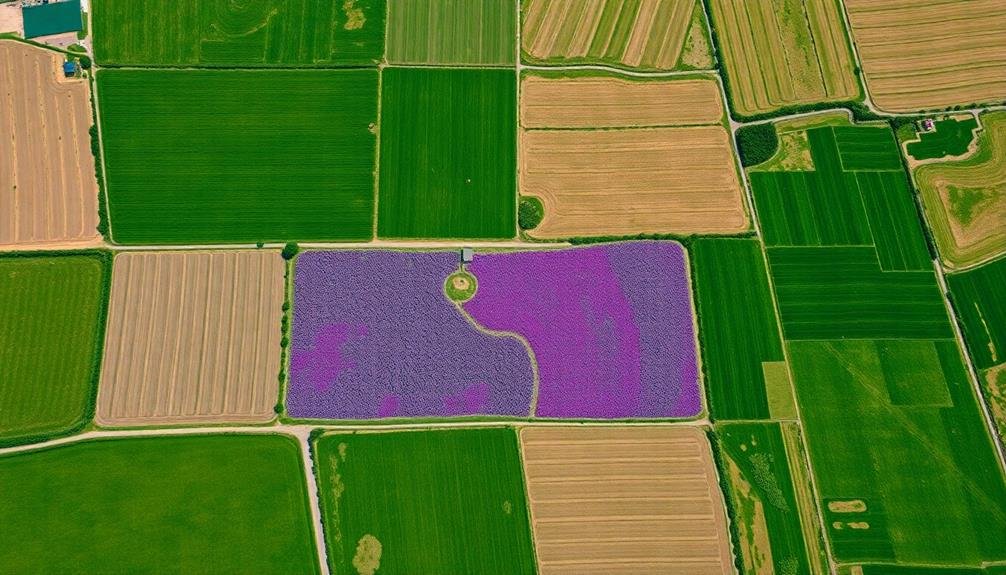
Invasive Species Distribution Mapping
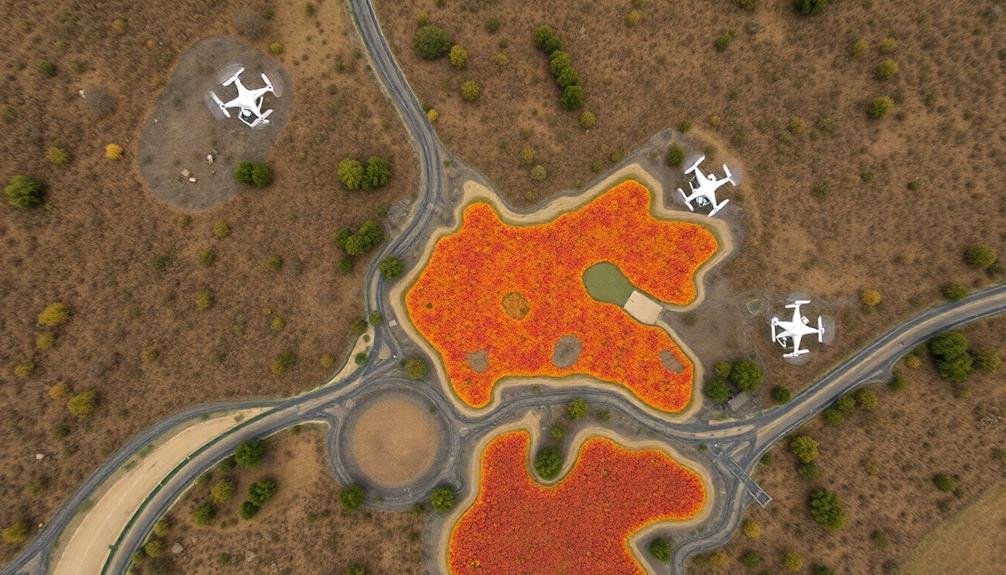
Once you've established reliable ground truthing methods, you're ready to map the distribution of invasive species across your study area. Distribution mapping provides a visual representation of where invasive species are located, their density, and how they're spreading over time.
You'll need to combine your ground-truthed data with remote sensing imagery and GIS software to create accurate maps. Start by plotting your field observations onto a base map of your study area. Then, use remote sensing data to identify areas with similar spectral signatures to your known invasive species locations.
You can create different layers for each species or invasion stage, allowing for a thorough view of the situation.
Here are key elements to include in your invasive species distribution maps:
- Species identification and density
- Habitat types and environmental conditions
- Temporal changes in distribution
- Potential spread pathways
- Management priority areas
Remember to update your maps regularly as new data becomes available. These maps will serve as vital tools for decision-makers, helping them allocate resources effectively and develop targeted management strategies.
They'll also aid in predicting future spread and identifying areas at risk of invasion, enabling proactive measures to protect vulnerable ecosystems.
Integrated Pest Management Approaches
Invasive species require a multifaceted approach to control and eradication. Integrated Pest Management (IPM) offers a thorough strategy that combines various techniques to minimize environmental impact while maximizing effectiveness. You'll find that IPM focuses on long-term prevention and management rather than relying solely on pesticides.
When implementing IPM, you'll start by identifying the invasive species and understanding its lifecycle. This knowledge helps you target vulnerabilities and choose the most appropriate control methods. You'll then set action thresholds to determine when intervention is necessary.
IPM encourages the use of biological controls, such as introducing natural predators or pathogens, as a first line of defense. You'll also employ cultural controls, like adjusting planting schedules or improving sanitation practices.
Mechanical and physical controls, such as trapping or barriers, can be effective for smaller infestations. If these methods prove insufficient, you'll consider chemical controls as a last resort, using targeted applications to minimize ecological impact.
Throughout the process, you'll monitor and evaluate the effectiveness of your chosen strategies, adjusting your approach as needed to guarantee long-term success in managing invasive species.
Regulatory Compliance for Aerial Surveys

When conducting aerial surveys for invasive species detection, you'll need to navigate a complex web of regulations.
Make certain you're familiar with both federal and state laws governing aerial operations. You'll likely need permits from the Federal Aviation Administration (FAA) and local authorities. These may include waivers for low-altitude flights or special use airspace access.
Environmental regulations also come into play. You'll need to take into account wildlife protection laws, especially in sensitive habitats.
Be aware of noise restrictions and potential impacts on protected species. Don't forget about privacy concerns – you'll need to comply with laws regarding aerial surveillance and data collection.
To stay compliant, follow these key steps:
- Obtain necessary flight permits and certifications
- Register your aircraft and equipment
- Develop a safety management system
- Train your crew on regulatory requirements
- Keep detailed records of all operations
Frequently Asked Questions
How Much Does a Typical Aerial Invasive Species Detection Program Cost?
You'll find costs for aerial invasive species detection programs vary widely. They can range from $10,000 to $100,000+ annually, depending on factors like survey frequency, area size, equipment used, and data analysis requirements.
What Qualifications Are Needed to Become an Aerial Invasive Species Detection Specialist?
You'll need a bachelor's degree in ecology, biology, or environmental science. Gain expertise in remote sensing, GIS, and aerial photography. Develop skills in species identification and data analysis. Get certified in drone operation and invasive species management.
How Do Weather Conditions Affect the Accuracy of Aerial Detection Methods?
You'll find that weather conditions greatly impact aerial detection accuracy. Cloud cover, precipitation, and wind can obscure visibility and affect sensor performance. Bright sunlight may cause glare, while fog or mist can reduce your ability to spot invasive species.
Are There Any Potential Negative Environmental Impacts of Frequent Aerial Surveys?
You'll find that frequent aerial surveys can disrupt wildlife, increase noise pollution, and contribute to carbon emissions. They may also cause habitat disturbance and stress in animals. It's important to balance detection needs with environmental concerns.
How Often Should Aerial Surveys Be Conducted for Optimal Invasive Species Management?
You'll want to conduct aerial surveys at least annually, but the frequency can vary. It depends on your specific invasive species, their growth rate, and your management goals. Don't forget to balance effectiveness with cost and environmental impact.
In Summary
You've now got a powerful toolkit for spotting invasive species from the air. From visual ID to cutting-edge hyperspectral analysis, you're equipped to detect unwanted intruders in various ecosystems. Remember to ground-truth your findings and stay compliant with regulations. By integrating these techniques into your pest management strategy, you'll be at the forefront of protecting native habitats. Keep honing your skills and stay vigilant—the battle against invasives is ongoing.
As educators and advocates for responsible drone use, we’re committed to sharing our knowledge and expertise with aspiring aerial photographers.

Leave a Reply