
Satellite imagery and aerial photography reveal habitat fragmentation from above in striking ways. You'll see linear infrastructure like roads and power lines slicing through landscapes. Agricultural expansion creates mosaic patterns, while urban sprawl encroaches on natural areas. Deforestation hotspots stand out as cleared patches amid dense forests. River systems show alterations from dams and channelization. Mining operations leave visible scars on the terrain. Wildfires reveal fragmented recovery patterns. Wildlife corridors become apparent, connecting isolated habitats. Protected area boundaries shift over time. Coastal development impacts are clearly visible along shorelines. These birds-eye views offer essential insights into our changing world.
Linear Infrastructure Networks
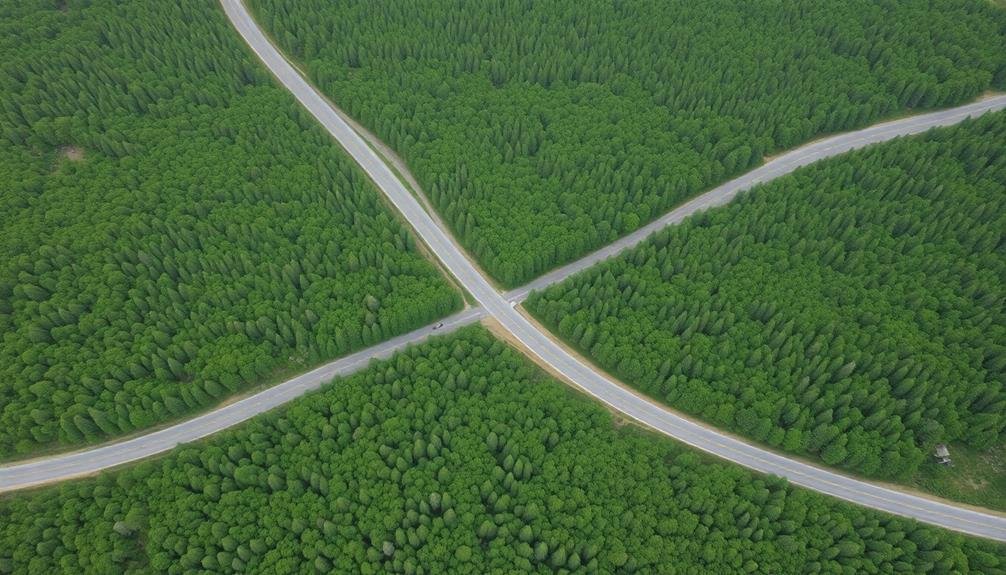
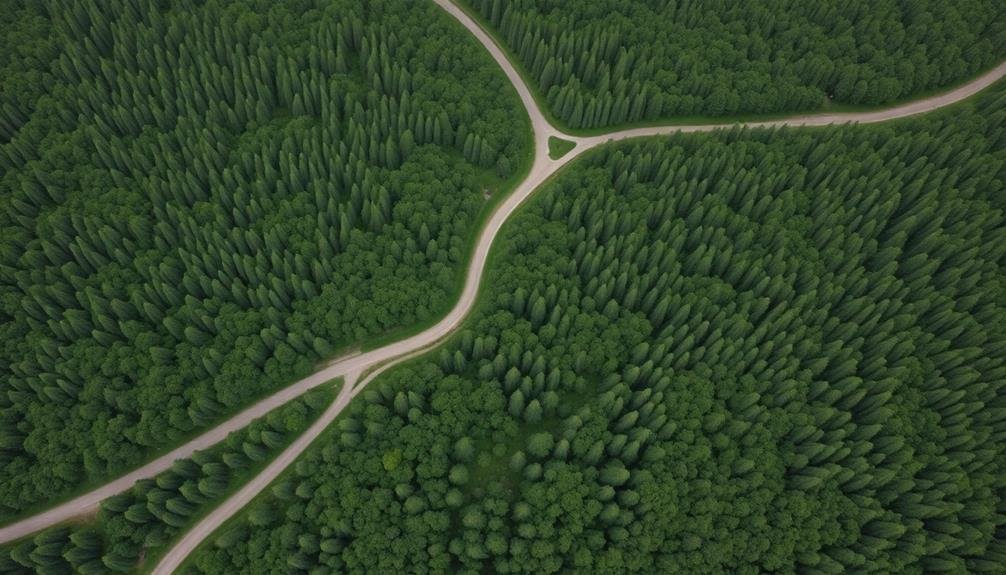
Linear infrastructure networks are major contributors to habitat fragmentation. When you look at satellite imagery or aerial photographs, you'll see a web of roads, railways, and power lines crisscrossing the landscape. These networks slice through natural habitats, creating barriers that wildlife struggle to cross. From above, you can easily spot how these linear structures divide once-continuous ecosystems into smaller, isolated patches.
You'll notice that roads are particularly prominent in fragmenting habitats. They appear as thin, often straight lines cutting through forests, grasslands, and wetlands. Railways have a similar effect, though they're usually less numerous than roads. Power line corridors are visible as long, cleared strips running through vegetation.
As you examine the imagery, you'll observe how these networks intersect and create a patchwork of divided habitats. You can see how animals might struggle to move between these fragments, especially in areas with dense infrastructure.
The imagery reveals the scale of fragmentation, showing you how even remote areas are impacted by human-made linear structures. By studying these patterns from above, you'll gain a clearer understanding of the extent and impact of habitat fragmentation caused by linear infrastructure networks.
Agricultural Expansion Patterns

When you observe satellite imagery of agricultural areas, you'll notice distinct patterns of habitat fragmentation.
You can easily spot the mosaic-like arrangement of crop fields, often accompanied by visible signs of deforestation as farmland expands into previously forested regions.
From space, you'll also see striking circular patterns created by center-pivot irrigation systems, which appear as green dots amidst the landscape.
Crop Field Mosaic Patterns
Farmers across the globe have transformed landscapes into intricate patchworks of crop fields. From above, you'll notice these mosaic patterns reveal the extent of agricultural expansion and its impact on habitat fragmentation.
As you study satellite imagery, you'll see geometric shapes of varying sizes and colors, each representing different crops or agricultural practices.
You'll observe how these patterns often follow natural contours of the land, with fields conforming to rivers, hills, and valleys. In some regions, you'll find circular patterns created by center-pivot irrigation systems, while in others, you'll see long, narrow strips characteristic of terrace farming on hillsides.
The boundaries between fields can tell you a lot about habitat connectivity. You might spot hedgerows, tree lines, or small patches of natural vegetation serving as corridors for wildlife.
However, in intensively farmed areas, you'll notice these connective elements are often missing, indicating severe habitat fragmentation.
Deforestation for Farmland
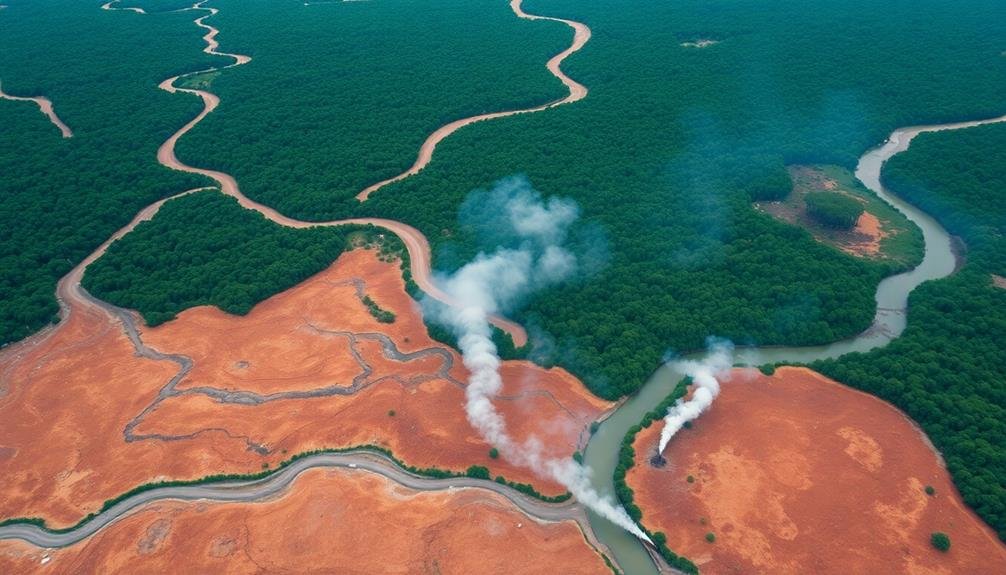
Satellite imagery's stark contrast reveals the march of agricultural expansion into forested areas. You'll notice a distinct boundary between the lush green canopy of intact forests and the geometric patterns of newly cleared farmland. These images capture the process of deforestation in real-time, showing how large swaths of trees are systematically removed to make way for crops or pastures.
From above, you can observe the progression of this land-use change. First, you'll see small clearings at the forest's edge, often following roads or rivers. As time passes, these clearings expand, creating a patchwork of bare soil and young crops. The once-continuous forest becomes fragmented, with isolated patches of trees surrounded by agricultural land.
You'll also notice how this fragmentation affects wildlife corridors. Animals that once roamed freely through vast forests now find their habitats divided and diminished. The imagery may reveal narrow strips of trees left standing between fields, serving as inadequate links between larger forest remnants.
Irrigation Circles From Space
Many striking patterns emerge when you observe agricultural landscapes from space. Among the most distinctive are circular irrigation patterns, often called "crop circles" or "pivot irrigation." You'll see these perfect circles dotting arid regions worldwide, where farmers use center-pivot irrigation systems to water their crops efficiently.
These circles represent a significant form of habitat fragmentation. They're typically 120-180 acres in size and stand out starkly against the surrounding dry land. From above, you'll notice:
| Feature | Description | Impact |
|---|---|---|
| Shape | Perfect circles | Unnatural boundaries |
| Size | 0.5-1 km diameter | Large-scale alteration |
| Color | Green amid brown | Contrast with native habitat |
| Pattern | Clustered or scattered | Mosaic landscape creation |
| Edges | Sharp, defined | Habitat isolation |
This irrigation method, while efficient for farming, creates a patchwork of cultivated land interspersed with natural areas. It's a prime example of how human agricultural practices can fragment habitats, affecting wildlife movement and ecosystem continuity. By studying these patterns from space, you can better understand the extent and impact of agricultural expansion on natural landscapes.
Urban Sprawl Visualization

As cities expand outward, urban sprawl becomes increasingly visible through aerial and satellite imagery. You'll notice a patchwork of development encroaching on natural areas, with roads and buildings fragmenting once-continuous habitats.
Time-lapse imagery allows you to witness this transformation over decades, revealing the rapid pace of urban growth.
From above, you can identify telltale signs of sprawl: low-density housing developments, strip malls, and extensive road networks. These features create a distinct visual pattern that contrasts sharply with surrounding rural or natural landscapes.
You'll observe how green spaces become isolated islands amidst a sea of concrete and asphalt.
Imagery also helps you detect the environmental impacts of urban sprawl. You can spot changes in vegetation cover, the loss of agricultural land, and the alteration of natural water systems.
Heat island effects become apparent through thermal imaging, showing how urbanization affects local climate patterns.
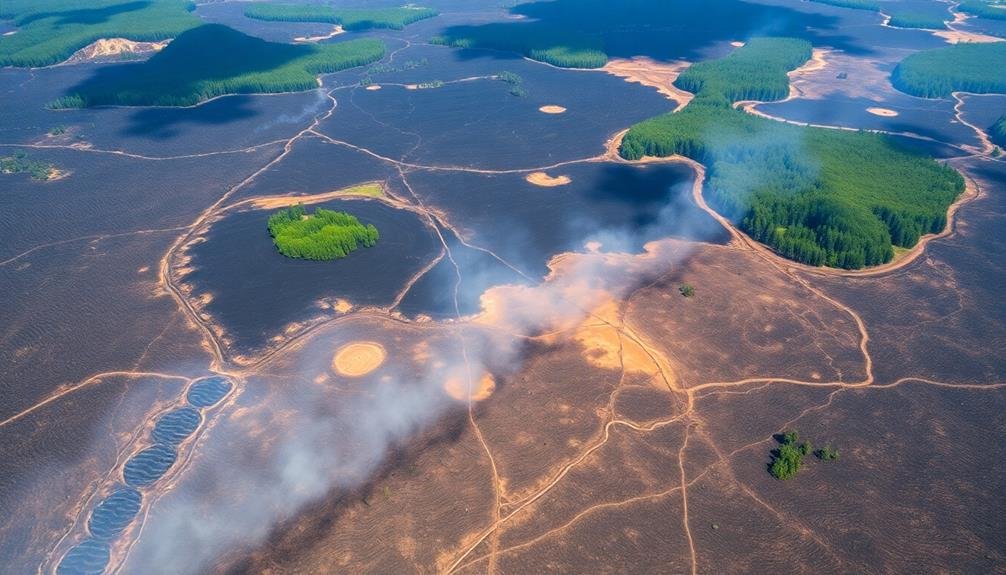
Deforestation Hotspots
Over the past few decades, deforestation hotspots have become glaringly apparent through remote sensing technology. Satellite imagery and aerial photography have revealed vast swaths of cleared land where lush forests once stood.
You'll notice these hotspots primarily in tropical regions, such as the Amazon rainforest, the Congo Basin, and Southeast Asian countries like Indonesia and Malaysia.
When you examine these images, you'll see a stark contrast between dense green canopies and barren, brown landscapes. Time-lapse sequences of satellite imagery showcase the rapid progression of deforestation, with roads cutting through forests and clearings expanding outward like a spreading stain.
You'll often spot geometric patterns in these cleared areas, indicating systematic logging or conversion to agricultural land. High-resolution imagery allows you to identify specific drivers of deforestation, such as palm oil plantations, cattle ranching, or mining operations.
You can even detect illegal logging activities by observing new access roads and small-scale clearings. By analyzing these hotspots, you'll gain essential insights into the rate and patterns of habitat fragmentation, enabling more effective conservation efforts and policy-making.
River System Alterations
You'll notice significant changes in river systems due to human intervention.
Dams interrupt the natural flow patterns, altering ecosystems both upstream and downstream.
Channelization straightens waterways, reducing habitat diversity, while the destruction of riparian zones eliminates vital buffer areas between land and water.
Dams Disrupt Natural Flow
One of the most significant impacts on river ecosystems comes from the construction of dams. From above, you'll see how these massive structures interrupt the natural flow of rivers, creating stark contrasts in the landscape.
Satellite imagery reveals abrupt changes in water levels, with vast reservoirs forming behind dams and drastically reduced water flow downstream.
You'll notice how dams fragment river habitats, preventing the free movement of aquatic species and altering sediment transport. Imagery shows sediment buildup behind dams, while downstream areas often appear clearer but suffer from erosion.
The dam's effects extend beyond the immediate area, impacting floodplains and wetlands that depend on natural flooding cycles.
Thermal imagery can highlight temperature differences caused by dams, as deep reservoirs release colder water downstream. This affects local ecosystems and can be seen as temperature anomalies in satellite data.
You'll also observe changes in vegetation patterns along riverbanks, with some areas becoming barren while others show increased growth due to altered water availability.
These visual cues from above provide clear evidence of how dams disrupt natural river systems and fragment habitats.
Channelization Straightens Waterways
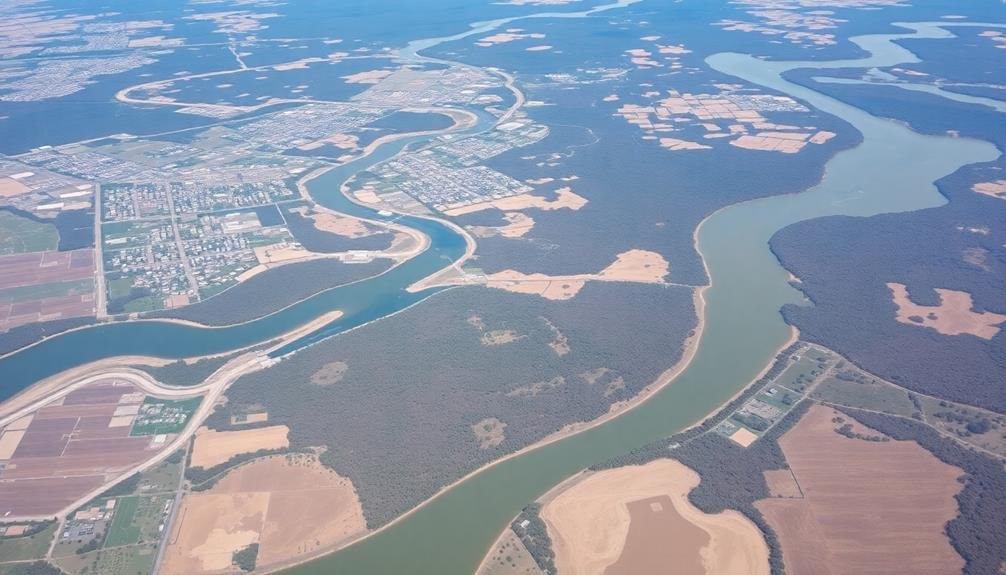
Aerial imagery reveals the stark contrast between natural meandering rivers and artificially straightened waterways.
You'll notice how channelized rivers appear as unnaturally straight lines cutting through the landscape, lacking the gentle curves and oxbows of their natural counterparts.
From above, you can see how channelization has transformed once-winding rivers into efficient drainage systems. These straightened waterways often have reinforced banks and a uniform width, designed to move water quickly downstream.
You'll observe how this alteration has eliminated the natural floodplains and wetlands that once bordered the river.
In satellite images, you'll spot the telltale signs of channelization: long, uninterrupted stretches of water with sharp angles where the river once meandered.
You can compare these to nearby natural waterways, which snake across the terrain in irregular patterns.
Look closely, and you'll notice how channelized rivers lack the diverse habitats found in natural systems.
The absence of sandbars, side channels, and varying depths becomes apparent from an aerial perspective, highlighting the loss of ecosystem complexity and biodiversity in these altered waterways.
Riparian Zone Destruction
When examining aerial imagery, the destruction of riparian zones becomes strikingly apparent. You'll notice stark contrasts between lush, vegetated river edges and barren, degraded shorelines. These essential buffer zones, once teeming with biodiversity, are now often reduced to thin strips or completely eliminated.
From above, you can spot telltale signs of riparian zone destruction:
| Indicator | Natural State | Degraded State |
|---|---|---|
| Vegetation | Dense, varied | Sparse, uniform |
| River shape | Meandering | Straightened |
| Land use | Undeveloped | Agricultural/urban |
As you scan the landscape, you'll observe how human activities encroach upon these crucial areas. Agricultural fields and urban development often extend right to the water's edge, leaving little room for natural habitats. You might see erosion scars, sediment plumes, and bank instability where riparian vegetation has been removed.
The consequences of this destruction are far-reaching. Without healthy riparian zones, rivers lose their natural filtration systems, wildlife corridors disappear, and aquatic ecosystems suffer. By identifying these changes through imagery, you can better understand the extent of habitat fragmentation and its impact on river systems.
Coastal Development Impact
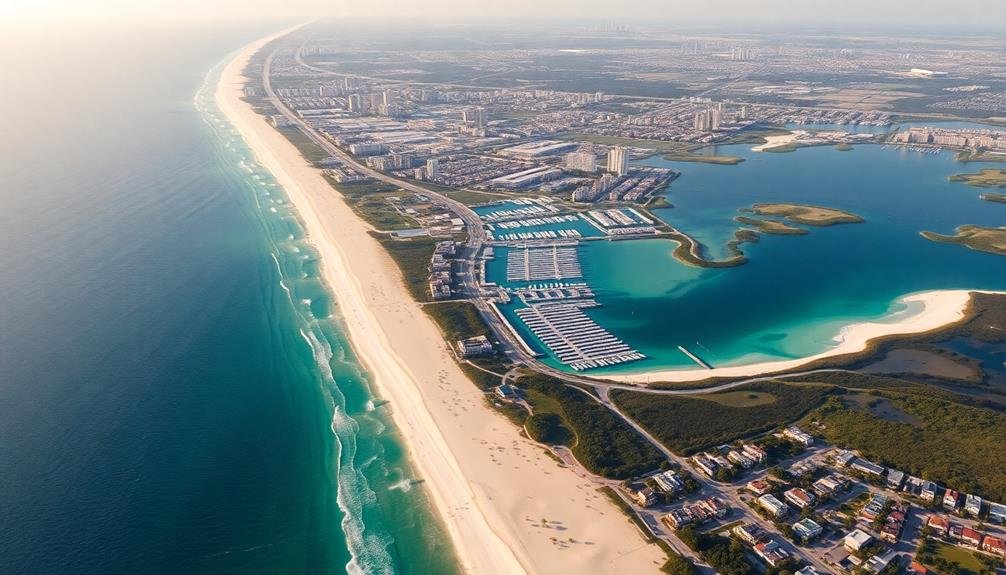
Along the world's coastlines, rapid development has led to severe habitat fragmentation, threatening diverse ecosystems and wildlife. Aerial imagery reveals the stark contrast between pristine coastal habitats and urbanized areas.
You'll notice how once-continuous stretches of mangroves, salt marshes, and dunes have been carved up by roads, buildings, and infrastructure. From above, you can see the patchwork of remaining natural areas, often isolated and disconnected.
These fragmented habitats struggle to support native species, as animals can't move freely between patches. You'll observe how coastal wetlands are drained and filled for construction, disrupting critical nursery grounds for fish and shorebirds.
Satellite images show the encroachment of artificial structures on nesting beaches, impacting sea turtles and other coastal wildlife. You'll notice how light pollution from coastal developments creates a visible glow at night, disorienting nocturnal species and altering natural behaviors.
Mining and Quarry Activities

Extracting resources through mining and quarrying operations leaves unmistakable scars on the landscape, visible in aerial and satellite imagery.
You'll notice vast open-pit mines, terraced quarries, and sprawling tailings ponds that fragment habitats and disrupt ecosystems. These activities create stark contrasts between natural terrain and industrialized areas.
From above, you can identify the telltale signs of mining: large, geometric excavations, often with stepped sides and distinctive colors that differ from the surrounding landscape.
Quarries appear as deep, rectangular cuts into hillsides or flat expanses. You'll spot access roads snaking through the terrain, connecting extraction sites to processing facilities.
Imagery reveals how these operations fragment habitats by creating physical barriers and altering land cover.
You can observe isolated patches of vegetation surrounded by barren ground, disrupted waterways, and changes in local topography.
Over time, you might detect the gradual expansion of mining areas, encroaching on nearby natural habitats.
Wildfire Damage Assessment
Satellite imagery plays a key role in evaluating wildfire damage, much like it does for mining impacts. You'll find that these images provide a thorough view of burned areas, allowing you to assess the extent and severity of habitat fragmentation caused by wildfires. By comparing pre-fire and post-fire imagery, you can identify changes in vegetation cover, soil composition, and landscape structure.
High-resolution satellite data enables you to detect fire scars, map burn severity patterns, and analyze the spatial distribution of affected habitats. You'll notice that different spectral bands can reveal information about vegetation health, moisture content, and regrowth patterns. This data helps you understand how wildfires create patchworks of burned and unburned areas, potentially isolating wildlife populations and disrupting ecosystem connectivity.
You can use time-series imagery to monitor post-fire recovery and track habitat regeneration over months or years. This information is essential for conservation efforts and land management decisions.
Wildlife Corridor Identification
While habitat fragmentation poses significant challenges for wildlife, satellite imagery offers a powerful tool for identifying potential wildlife corridors. You can use high-resolution imagery to detect natural pathways that connect isolated habitat patches. These corridors are essential for animal movement, genetic diversity, and population resilience.
By analyzing satellite data, you'll spot linear features like rivers, ridgelines, or forested strips that could serve as corridors. You can combine this visual information with land cover classification to identify suitable habitats and barriers. Advanced image processing techniques allow you to map landscape connectivity and assess the quality of potential corridors.
You'll also use time-series imagery to track changes in vegetation and land use that might affect corridor viability. This temporal analysis helps you understand seasonal variations and long-term trends in habitat connectivity.
Protected Area Boundary Changes

Beyond identifying wildlife corridors, satellite imagery plays a key role in monitoring protected area boundaries. You'll find that high-resolution imagery allows conservationists to track changes in protected area borders over time. This technology helps detect encroachment, illegal logging, or agricultural expansion that may be eating away at the edges of national parks, reserves, or other protected habitats.
By comparing current images with historical data, you can spot gradual shifts in boundaries that might otherwise go unnoticed. You'll see how human activities like urban development or resource extraction can slowly chip away at protected areas. Imagery also reveals the effectiveness of conservation efforts, showing whether buffer zones are maintaining their integrity or if restoration projects are successfully expanding protected habitats.
Moreover, you can use this data to assess the impact of policy changes on protected area size and shape. It's particularly useful in remote or conflict-prone regions where ground surveys are challenging.
Frequently Asked Questions
How Accurate Are Satellite Images in Detecting Small-Scale Habitat Changes?
You'll find satellite images quite accurate for detecting small-scale habitat changes. They can reveal shifts in vegetation, land use, and even individual trees. However, their accuracy depends on resolution and frequency of image capture.
What Role Does Artificial Intelligence Play in Analyzing Habitat Fragmentation Imagery?
You'll find AI's essential in analyzing habitat fragmentation imagery. It can quickly process vast datasets, detect patterns, and identify changes over time. AI algorithms improve accuracy, speed up analysis, and provide insights humans might miss.
How Often Are Habitat Fragmentation Images Updated for Monitoring Purposes?
You'll find that habitat fragmentation images are typically updated annually or bi-annually. However, it's not uncommon for some areas to be monitored more frequently, especially if they're undergoing rapid changes or are of particular ecological importance.
Can Imagery Reveal the Impact of Habitat Fragmentation on Specific Animal Species?
Yes, imagery can show you how habitat fragmentation affects specific animals. You'll see changes in population sizes, movement patterns, and breeding areas. It's especially useful for tracking large mammals, birds, and reptiles across fragmented landscapes.
What Are the Limitations of Using Aerial Imagery for Habitat Fragmentation Assessment?
You'll find aerial imagery has limitations for evaluating habitat fragmentation. It can't show small-scale changes, underground habitats, or animal movements. You're also limited by image resolution, cloud cover, and the need for frequent updates.
In Summary
You've seen how aerial imagery exposes habitat fragmentation in striking detail. From linear infrastructure to urban sprawl, these views reveal nature's dismantling. But don't despair – you can use this knowledge to advocate for change. Support wildlife corridors, push for sustainable development, and champion reforestation efforts. By understanding fragmentation's visual signs, you're better equipped to protect and restore habitats. Keep looking up – the view from above holds keys to conservation.
As educators and advocates for responsible drone use, we’re committed to sharing our knowledge and expertise with aspiring aerial photographers.


Leave a Reply